8 As-you-go instead of after-the-fact: A network approach to scholarly communication and evaluation
Scholarly research faces threats to its sustainability and has been said to face a reproducibility crisis (Baker 2016) amongst other pernicious problems such as access and exclusivity. The underlying cause might be the way we have collectively designed the reporting and rewarding of research (implicitly or explicitly). The current scholarly communication system is primarily organized around researchers who publish static (digital) research papers in scholarly journals. Many of these journals have artificial page limits (in the digital age), which leads to artificial scarcity and subsequently increases the perceived prestige of such a journal due to high rejection rates (71% on average for APA journals in 2016; perma.cc/Q7AT-RN5C). Furthermore, scholarly communication has become highly centralized, where over 50% of all papers are published by as little as five publishers (over 70% for social sciences; Larivière, Haustein, and Mongeon 2015). Centralization has introduced knowledge discrimination, as publishers are able to influence who can access scholarly knowledge, what gets published, and allows for other single points of failure to arise with their own consequences (e.g., censorship; perma.cc/HDX8-DJ8F). In order to have a sustainable scholarly research system, we consider it necessary to implement changes that provide progress on multiple of these threats at once instead of addressing them individually.
Systems design directly affects what the system and the people who use it can do; scholarly communication still retains an analog based design affecting the effectivity of the spread and production of knowledge dissemination (see also Kling and Callahan 2005). Researchers and institutions are evaluated on where and how much papers they publish (as a form of prestige). For example, an oft-used measure of quality is the Journal Impact Factor (JIF; Garfield 2006). The JIF is also frequently used to evaluate the ‘quality’ of individual papers under the assumption that a high impact factor predicts the success of individual papers, which has been debunked many times (Prathap, Mini, and Nishy 2016; Seglen 1992; Seglen 1994). Many other performance indicators in the current system (e.g., citation counts and h-indices) resort to generic bean counting. Inadequate evaluation measures leave universities, individual researchers, and funders (amongst others) in the dark with respect to the substantive questions they might have about the produced scholarly knowledge. Additionally, work that is not aptly captured by the authorship of papers is likely to receive less recognition (e.g., writing software code) due to reward systems counting publications instead of contributions (see also perma.cc/MUH7-VCA9). It is unfeasible that a paper-based approach to scholarly communication can escape the consequences of paper’s limitations.
A scholarly communication system is supposed to serve five functions, but can do so in a narrow sense as it currently does, or in a wider sense. These functions of the scholarly communication system are (1) registration-, (2) certification-, (3) awareness-, and (4) archival (Roosendaal and Geurts 1998), and (5) incentives (Sompel et al. 2004). A narrow fulfillment of for example the registration function would mean that findings that are published are registered, but not all findings are registered (e.g., due to selective publication; (Franco, Malhotra, and Simonovits 2014)). Similarly, certification is supposed to occur through peer review, but peer review can exacerbate human biases in the assessment of quality (e.g., statistical significance increasing the perceived quality of methods; Mahoney 1977).
We propose an alternative design for scholarly communication based on modular research outputs with direct links between subsequent modules, forming a network. Whereas a paper-based approach communicates after a whole research cycle is completed, modular communication was proposed two decades ago (Kircz 1998; Sompel et al. 2004; Kuhn et al. 2016; Groth, Gibson, and Velterop 2010; Velterop 2010; Nielsen 2012). These modules could be similar to sections of a research paper, but extend to modular research outputs such as software or materials. We propose to implement this modular communication on an “as-you-go” basis and include direct links to indicate provenance. This respects the chronological nature of research cycles and decreases the possibility for pernicious problems such as selective publication and making predictions after results are known (HARKing; Kerr 1998).
With a network structure between modules of knowledge, we can go beyond citations and facilitate different questions about single- or collectives of knowledge. For example, how central is a single module in the larger network? Or: How densely interconnected is this collective of knowledge modules? A network could facilitate question-driven evaluation where an indicator needs to be operationalized per question, instead of indicators that have become a goal in themselves and become invalidated by clear cheating behaviors (Seeber et al. 2017; “The Impact Factor Game” 2006). As such, we propose to make evaluation of research its own research process with question formulation, operationalizations, and data collection (i.e., constructing the network of interest).
8.1 Network structure
Research outputs are typically research papers, which report on at least one research cycle after it has occurred. The communicative design of papers embeds hindsight and its biases in the reporting of results by being inherently reconstructive. Moreover, this design eliminates the verification of the chronology within a paper. On the other hand, the paper encompasses so much that citations to other papers can indicate a tangent or a crucial link. Additionally, the paper is a bottleneck for what is communicated: It cannot properly deal with code, data, materials, etc.
When stages of research are communicated separately and as they occur, it changes the communicative design to eliminate hindsight and allows more types of outputs to be communicated as separate modules. For example, a theory can be communicated first and hypotheses communicated second, as a direct descendant of the theory. Subsequently, a study design can be linked as a direct descendant of the hypotheses, materials as a direct descendant of the design, and so on. This would allow for the incorporation of materials, data, and analysis code (amongst others). In this structure, many modules could link to a single module (e.g., replication causes many data modules to connect to the same hypotheses module) but one module can also link to many other modules (e.g., when hypotheses follow from multiple theories or when a meta-analytic module is linked to many results modules).
Figure 8.1 shows two simple examples of how these different modular research outputs (i.e., modules) would directly connect to each other. The connection between these modules only shows the direct descendance and could still include citations to other pieces of information. For example, a discussion module could be a direct descendant of a results module and could still include citations to other relevant findings. When one research cycle ends, a new one can link to the last module, continuing the chain of descendance. Incorporating the direct descendancy of these knowledge modules builds a different kind of network than citation and authorship networks. As such, this network would be an addition to these already existing citation and authorship networks; it does not seek to replace them.
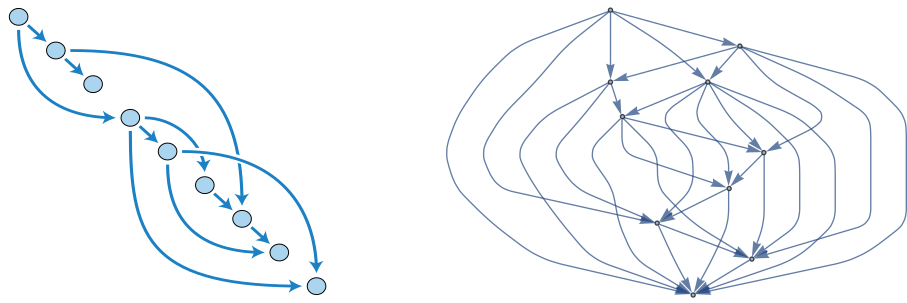
Figure 8.1: Two Directed Acyclic Graphs (DAGs) of connected research stages. The ordering is chronological (top-bottom) and therefore modules that are situated below one another cannot refer upwards. Panel A shows a less complex network of modules; Panel B shows a more extensive network of modules.
Given that these modular outputs would be communicated as they occur, chronology is directly embedded in the communication process with many added benefits. For example, preregistration of hypotheses tries to ensure that predictions precede observations, which would be embedded with modular communication where predictions are communicated when they are made (exploratory research could be communicated without hypotheses; for a more extensive discussion of the benefits and limits of preregistration see Nosek et al. 2018). Moreover, if modular outputs are communicated as they are produced, selective reporting (i.e., publication bias) is reduced by having already communicated the data before results are generated.
With immutable append-only registers, the chronology and content integrity of these outputs can be ensured and preserved over time. This can occur efficiently and elegantly with the Dat protocol (without a blockchain; perma.cc/GC8X-VQ4K). In short, the Dat protocol is a peer-to-peer protocol (i.e., decentralized and openly accessible) that provides non-adjustable timestamps to each change that occurs within a folder, which is given a permanent unique address on the peer-to-peer Web (\(36^{64}\) addresses possible; Ogden 2017). The full details, implications, and potential implementations of this protocol for scholarly communication fall outside of the scope of this chapter (an extended technical explanation of the application of the Dat protocol can be found in the next chapter).
A continuous and network based communication system could take a wider interpretation of the scholarly functions it is supposed to serve (Roosendaal and Geurts 1998; Sompel et al. 2004). Registration would become more complete, because selective publication based on results is preempted by embedding communication before any results are known. Certification is improved by embedding the chronology of a research cycle into the communication of research, ensuring that predictions precede results (Nosek et al. 2018). Awareness is improved by using open by design principles, whereas awareness is now limited by financial means to access scholarly papers (Tennant et al. 2017). Archival would not only be simplified with peer-to-peer protocols, but also allows anyone to create a copy and could result in excessive redundancy under the Lots Of Copies Keeps Stuff Safe principle (LOCKSS; Reich and Rosenthal 2001). In the next sections, we extend on how incentives could be adjusted in such a network structure, to facilitate both the evaluation of research(ers) and the planning of research.
8.2 Indicators
With a chronological ordering of various modular research outputs and their parent relations, a directional adjacency matrix can be extracted for network analysis. Table 8.1 shows the directional adjacency matrix for Figure 8.1 (Panel A). Parent modules (i.e., modules) must precede the child modules in time, therefore only \(\frac{J(J-1)}{2}\) of cells of the adjacency matrix are filled in, where \(J\) is the number of research modules.
| module01 | module02 | module03 | module04 | module05 | module06 | module07 | module08 | module09 | |
|---|---|---|---|---|---|---|---|---|---|
| module01 | 1 | 0 | 1 | 0 | 0 | 0 | 0 | 0 | |
| module02 | 1 | 0 | 0 | 0 | 1 | 0 | 0 | ||
| module03 | 0 | 0 | 0 | 0 | 0 | 0 | |||
| module04 | 1 | 1 | 0 | 0 | 1 | ||||
| module05 | 0 | 0 | 1 | 1 | |||||
| module06 | 1 | 0 | 0 | ||||||
| module07 | 1 | 0 | |||||||
| module08 | 0 | ||||||||
| module09 |
With a directional adjacency matrix, countless network indicators can be calculated that could be useful in research evaluation depending on the questions asked. However, not all network indicators are directly applicable because a time based component is included in the network (i.e., new outputs cannot refer to even newer outputs). Below, we propose some basic network indicators for evaluating past and future research outputs.
Networks indicators could be used to evaluate the network as it exists now or how it developed in the past (i.e., backward-looking evaluation). For example, in-degree centrality could be used to identify highly interconnected modules of information. This measure indicates how many child modules are spawned by a parent module and indicates how much new work a researcher’s output stimulates (e.g., module04 in Table 8.1 would have an in-degree centrality of three). To contextualize this, a data module could spawn four results modules, hence has an in-degree centrality of four. This measure would look only at one-generation of child modules, but other measures extend this to incorporate multiple generations of child modules. Katz centrality extends this and computes the centrality over \(N\) generations of child modules (pp. 206-210; Wasserman and Faust 1994) whereas traditional in-degree centrality calculates centrality for \(N=1\) generations. For example, two data modules that each spawn five results modules would have the same in-degree centrality, but could have different Katz centrality if only one of those two networks has a third-generation of modules included. If multi-generation indicators are relevant, Katz centrality measures could provide operationalizations of such measures.
Another set of network indicators could be used to evaluate how the network would change when new modules are added in the future (i.e., forward-looking evaluation). For example, a researcher who is looking for ways to increase the density in their own network, could ask the question “If I would add one module that has \(k\) parents, which addition would increase the density the most?” Subsequently, the researcher could inspect the identified connections for inspiration and feasibility. Complexity of the new module could be increased by increasing the number of parent modules to connect (\(k\) in the question; e.g., five instead of two). Potentially, this could facilitate creative thinking, where \(k\) is gradually increased over time to increase the complexity of the issue from a network perspective.
The indicators we highlighted here are simple proposals. Other indicators from network analysis and graph theory could be applied to the study of knowledge development when a network structure is available and we hope to see suggestions to answer questions about the network. These kinds of analyses are already done within citation networks (e.g., Fortunato et al. 2018) and authorship networks (e.g., Morel et al. 2009), but we cannot do so with the provenance or planning of knowledge generation in the current scholarly communication system.
8.3 Use cases
We describe three use cases of network based evaluation to contextualize the ideas proposed above. For each use case, we first provide a general and non-exhaustive overview of the possibilities with network based evaluation. Subsequently, we specify a scenario for that use case, how an evaluation question flows from that scenario, how an indicator to answer that question could be operationalized, and how that indicator could inform the evaluation process. With these use cases we hope to illustrate that network based evaluation could align better with the implicit evaluation criteria already present in common research evaluation scenarios.
8.3.1 Funders
Funders of scholarly research often have specific aims when distributing their financial resources amongst researchers. Funders often use generic “one size fits all” indicators to evaluate the quality of researchers and research (e.g., JIF, h-index, citation counts). Given that funding calls often have specific aims, these funding calls could be used as the basis of research evaluation if we move beyond these generic measures.
A scenario could exist where a funding agency wants to fund researchers to extend an existing and interconnected research line. This is not an implausible scenario, where funding agencies aim to fund several million dollars (or similar in other currencies) in order to increase follow through in research lines. A specific example might be the Dutch national funding agency “Vici” funding scheme, which aims to fund “senior researchers who have successfully demonstrated the ability to develop their own innovative lines of research” (https://perma.cc/GB83-RE4J).
Whether researchers who submitted proposals actually built a connected research line could be evaluated by looking at how interconnected each researcher’s personal network of modules is. Let us assume that a research line here would mean that new research efforts interconnect with previous efforts by that same researcher (i.e., building on previous work). Additionally, we could assume that building a research line means that the research line becomes more present in the network over the years. Building a research line thus could be reformulated into questions about the network of directly linked output and its development over time.
Operationalizing the concept ‘research line’ as increased interconnectedness of modules over time, we could compute the network density per year. One way of computing density would be to tally the number of links and divide them by the number of possible links. By taking snapshots of the network of outputs of that researcher in for example the last five years on January 1st, we could compute an indicator to inform us about the development of the researcher’s network of outputs.
The development of network density over time could help inform the evaluation, but one measure could hardly be deemed the only decision criterion. As such, it only provides an indication as to whether an applicant aligns with the aim of the funding agency. Other questions would still need to be answered by the evaluation committee. For example, is the project feasible or does the proposal extend the previous research line? Some of these other questions could also be seen as questions about the future development of the network and serve as their own questions to investigate the applicant on.
8.3.2 Universities
Universities can use research evaluation for the internal allocation of resources and to hire new scientists. As such, a research group within a university could apply network analysis to assess how (dis)connected a group’s modules are or how their group compares to similar groups at other institutions. Using network indicators, it could become possible to assess whether a job applicant fulfills certain criteria, such as whether their modules connect to existing modules of a group. If a university wants to stimulate more diversity in research background, network analysis could also be used to identify those who are further removed from the current researchers at the institution. Considering that universities are often evaluated on the same generic indicators as individual researchers (e.g., JIF) in the rankings, such new and more precise evaluation tools might also help specify university goals.
Extending the scenario above, imagine a research group that is looking to hire an assistant professor with the aim of increasing connectivity between the group’s members. The head of the research group made this her personal goal in order to facilitate more information exchange and collaborative potential within the group. By making increasing connectivity within the group an explicit aim of the hiring process, it can be incorporated into the evaluation process.
In order to achieve the increased connectivity within the research group, the head of the research group wants to evaluate applicants relatively but also with an absolute standard. Relative evaluation could facilitate applicant selection, but absolute evaluation could facilitate insight into whether any applicant is sufficient to begin with. In other words, relative evaluation here asks which is the best applicant, whereas absolute evaluation asks whether the best applicant is good enough. These decision criteria could be preregistered in order to ensure a fair selection process.
Increased connectivity could be computed as a difference measure of the research group’s network density with and without the applicant. In order to take into account the number of produced modules, the computed density could take into account the number of modules of an applicant. Moreover, the head stipulates that the minimum increase in network density needs to be five percentage points. To evaluate applicants, each gets a score that is made up of the difference between the current network density and the network density if they were hired. For example, baseline connectivity within a group might be 60%, hence, the network density has to be at least 65% for one of the applicants to pass the evaluation criterium.
If the head of the research group relied purely on the increase in network density as an indicator without further evaluation, a hire that decreases morale in the research group could easily be made. For example, it is reasonable to assume that critics of a research group often link research outputs in a criticism of their work. If such a person would apply for a job within that group, the density within the network might be increased but subsequently result in a more hostile work climate. Without evaluating the content of the applicant that increases the network density, it would be difficult to assess whether they would actually increase information exchange and collaborative potential instead of stifling it.
8.3.3 Individuals
Individual researchers could use networks to better understand their research outputs and plan new research efforts. For example, simply visualizing a network of outputs could prove a useful tool for researchers to view relationships between their outputs from a different perspective. Researchers looking for new research opportunities could also use network analysis to identify their strengths, by comparing whether specific sets of outputs are more central than others in a larger network. For example, a researcher who writes software for their research might find that their software is more central in a larger network than their theoretical work, which could indicate a fruitful specialization.
One scenario where network evaluation tools could be valuable for individual researchers is resource allocation needs to be optimized. A researcher might want to revisit previous work and conduct a replication, but only has funds for one such replication. Imagine a researcher wants to identify an effect that they previously studied and which has been central to their new research efforts. Identifying which effect to replicate is intended by this researcher as a safeguard mechanism to prevent further investment in new studies, if a fundamental finding proves to not be replicable.
In this resource allocation scenario, the researcher aims to identify the most central finding in a network. The researcher has conducted many studies throughout their career and does not want to identify the most central finding in the entire network of outputs over the years, but only of the most recent domain they’ve been working in. As such, the researcher takes the latest output and traces all the preceding outputs automatically to five generations, to create a subset of the full network and to incorporate potential work not done by themselves.
Subsequently, by computing the Katz centrality of the resulting subnetwork, the researcher can compute the number of outputs generated by a finding and how many outputs those outputs generated in return. By assigning this value to each module in the network, the researcher can identify the most central modules. However, these modules need to be investigated subsequently in order to see whether they are findings or something else (e.g., theory; we assume an agnostic infrastructure that does not classify modules).
Katz centrality can be a useful measure to identify which finding to replicate in a multi-generational network, but would fail to take into account what replications have already been conducted. When taking the most recent output and looking at its parent(s), grandparent(s), etc., this only looks at the lineage of the finding. However, the children of all these parents are not taken into account in such a trace. As such, the researcher in our scenario might identify an important piece of research to replicate, but neglect that it has already been replicated. Without further inspection of the network for already available replications, resource allocation might be suboptimal after all.
8.4 Discussion
We propose to communicate research in modular “as-you-go” outputs (e.g., theory followed by hypotheses, etc.) instead of large “after-the-fact” papers. Modular communication opens up the possibility of a network of knowledge to come into existence when these pieces are linked (e.g., results descend from data). This network of knowledge would be supplementary to traditional citation networks and could facilitate new evaluation tools that are based in the question of interest rather than generic “one size fits all” indicators (e.g., Journal Impact Factor, citation counts, number of publications). Given the countless questions and operationalizations possible to evaluate research in a network of knowledge, we hope this would increase the focus on indicators as a tool in the evaluation process instead of indicators being the evaluation process itself (Hicks et al. 2015; Wilsdon et al. 2015).
We highlighted a few use cases and potential indicators for funders, research collectives, and individuals, but recognize that we are merely scratching the surface of possible use cases and implementations of network analysis in research evaluation. The use cases presented for the various target groups (e.g., universities) can readily be transferred to suit other target groups (e.g., individuals). Award committees might use critical path analysis or network stability analysis to identify key hubs in a network to recognize. Moreover, services could be built to harness the information available in a network to identify people who could be approached for collaborations or to facilitate the ease with which such network analyses can be conducted. Future work could investigate more use cases, qualitatively identify what researchers (or others) would like to know from such networks, and how existing network analysis methods could be harnessed to evaluate research and better understand its development over time. Despite our enthusiasm for network based evaluation, we also recognize the need for exploring the potential negative sides of this approach. Proximity effects might increase bias towards people already embedded in a network and might exacerbate inequalities already present. Researchers might also find ways to game these indicators, which warrants further investigation.
Communicating scholarly research in modular “as-you-go” outputs might also address other threats to research sustainability. In modular “as-you-go” communication, selective publication based on results would be reduced because data would be communicated before results are known. Similarly, adjusting predictions after results are known would be reduced because predictions would be communicated before data are available (i.e., preregistration by design). Replications (or reanalyses) would be encouraged both for the replicated (the replicated module gets more child modules, increasing its centrality) and the replicator (time investment is lower due to only having to add a data module that is linked to the materials module of the replicated). Self-plagiarism could be reduced by not forcing researchers to rehash the same theory across papers that spawn various predictions and studies. These various issues (amongst other out of scope issues) could be addressed jointly instead of each issue vying for importance for researchers, funders, or policy makers (amongst others).
To encourage culture- and behavioral change, “after-the-fact” papers and modular “as-you-go” outputs could co-exist (initially) and would not require researchers to make a zero-sum decision. Copyright is often transferred to publishers upon publication (resulting in pay-to-access), but only after a legal contract is signed. Hence, preprints cannot legally be restricted by publishers when they precede a copyright transfer agreement. However, preprints face institutional and social opposition (Kaiser 2017), where preprinting could exclude a manuscript for publication depending on editorial policies or due to fears of non-publication or scooping (itself a result of hypercompetition). In recent years, preprints have become more widely accepted and less likely to exclude manuscript publication (e.g., Science accepts preprinted manuscripts; Berg 2017). Similarly, sharing modular “as-you-go” outputs could not legally be restricted by publishers and can ride the wave of preprint acceptance, but might also face institutional or social counterchange similar to preprints. Researchers could communicate “as-they-go” and compile “after-the-fact” papers, facilitating co-existence and minimizing negative effects on career opportunities. Additionally, “as-you-go” modules could be used in any scholarly field where the provenance of information is important to findings and is not restricted to empirical and hypothesis driven research per se.
As far as we know, modular “as-you-go” scholarly communication infrastructure that includes direct links between modules has not yet been available to researchers in a sustainable way. One of the few thought styles that has facilitated “as-you-go” reporting in the past decade is that of Open Notebook Science (ONS; Bradley 2007), where researchers share their day-to-day notes and thoughts. However, ONS has remained on the fringes of the Open Science thought style and has not matured, limiting its usefulness and uptake. For example, ONS increases user control because communication occurs on personal domains, but does not have a mechanism of preserving the content. Considering reference rot occurs in seven out of ten scholarly papers containing Weblinks (M. Klein et al. 2014), concern for sustainable ONS is warranted without further development of content integrity. Moreover, ONS increases information output without providing more possibilities of discovering that content.
Digital infrastructure that facilitates “as-you-go” scholarly communication is now feasible and sustainable. Feasible because the peer-to-peer protocol Dat provides stable addresses for versioned content and it ensures content integrity across those versions. Sustainable because preservation in a peer-to-peer network is relatively trivial (inherent redundancy, anyone can rehost information and libraries could be persistent hosters) and removes (or at least reduces) the need for centralized services in scholarly communication. Consequently, this decreases the need for inefficient server farms of centralized services (Cavdar and Alagoz 2012) by decentralizing services. However, preservation is a social process that requires commitment. Hence, a peer-to-peer infrastructure would require committed and persistent peers (e.g., libraries) to make sure content is preserved. Another form of sustainability is knowledge inclusion, which is facilitated by a decentralized network protocol that is openly accessible.
Finally, we would like to note that communication was not instantly revolutionized by the printing press but changed society over the centuries that followed. The Web has only been around since 1991 and its effect on society is already pervasive, but far from over. We hope that individuals who want change do not despair by feelings of inertia in scholarly communication throughout recent years and further entrenching of positions and interests. We remain optimistic for substantial change to occur within scholarly communication that improves the way we communicate research and hope these ideas contribute in working towards that.
8.5 Conclusion
The current scholarly communication system based on research papers is “after-the-fact” and can be supplemented by a modular “as-you-go” based communication system. By doing so, the functions of a scholarly communication system can be interpreted more widely, making registration complete, certification part of the process instead of just the judgment of peers, access to everything for everyone based on peer-to-peer protocols, simplify archival, and facilitate incentive structures that could align researcher’s interests with that of scholarly research.
References
Baker, Monya. 2016. “1,500 Scientists Lift the Lid on Reproducibility.” Nature 533 (7604). Springer Nature: 452–54. doi:10.1038/533452a.
Berg, Jeremy. 2017. “Preprint Ecosystems.” Science 357 (6358). American Association for the Advancement of Science (AAAS): 1331–1. doi:10.1126/science.aaq0167.
Bradley, Jean-Claude. 2007. “Open Notebook Science Using Blogs and Wikis.” Nature Precedings, June. Springer Nature. doi:10.1038/npre.2007.39.1.
Cavdar, Derya, and Fatih Alagoz. 2012. “A Survey of Research on Greening Data Centers.” 2012 IEEE Global Communications Conference (GLOBECOM), December. IEEE. doi:10.1109/glocom.2012.6503613.
Fortunato, Santo, Carl T. Bergstrom, Katy Börner, James A. Evans, Dirk Helbing, Staša Milojević, Alexander M. Petersen, et al. 2018. “Science of Science.” Science 359 (6379). American Association for the Advancement of Science (AAAS): eaao0185. doi:10.1126/science.aao0185.
Franco, Annie, Neil Malhotra, and Gabor Simonovits. 2014. “Publication Bias in the Social Sciences: Unlocking the File Drawer.” Science 345 (6203): 1502–5. doi:10.1126/science.1255484.
Garfield, Eugene. 2006. “The History and Meaning of the Journal Impact Factor.” JAMA 295 (1). American Medical Association (AMA): 90. doi:10.1001/jama.295.1.90.
Groth, Paul, Andrew Gibson, and Jan Velterop. 2010. “The Anatomy of a Nanopublication.” Information Services & Use 30 (1-2). IOS Press: 51–56. doi:10.3233/isu-2010-0613.
Hicks, Diana, Paul Wouters, Ludo Waltman, Sarah de Rijcke, and Ismael Rafols. 2015. “Bibliometrics: The Leiden Manifesto for Research Metrics.” Nature 520 (7548). Springer Nature: 429–31. doi:10.1038/520429a.
Kaiser, Jocelyn. 2017. “Are Preprints the Future of Biology? A Survival Guide for Scientists.” Science, September. American Association for the Advancement of Science (AAAS). doi:10.1126/science.aaq0747.
Kerr, Norbert L. 1998. “HARKing: Hypothesizing After the Results Are Known.” Personality and Social Psychology Review 2 (3). SAGE Publications: 196–217. doi:10.1207/s15327957pspr0203_4.
Kircz, Joost G. 1998. “Modularity: The Next Form of Scientific Information Presentation?” Journal of Documentation 54 (2). Emerald: 210–35. doi:10.1108/eum0000000007185.
Klein, Martin, Herbert Van de Sompel, Robert Sanderson, Harihar Shankar, Lyudmila Balakireva, Ke Zhou, and Richard Tobin. 2014. “Scholarly Context Not Found: One in Five Articles Suffers from Reference Rot.” Edited by JuditEditor Bar-Ilan. PLoS ONE 9 (12). Public Library of Science (PLoS): e115253. doi:10.1371/journal.pone.0115253.
Kling, Rob, and Ewa Callahan. 2005. “Electronic Journals, the Internet, and Scholarly Communication.” Annual Review of Information Science and Technology 37 (1). Wiley: 127–77. doi:10.1002/aris.1440370105.
Kuhn, Tobias, Christine Chichester, Michael Krauthammer, Núria Queralt-Rosinach, Ruben Verborgh, George Giannakopoulos, Axel-Cyrille Ngonga Ngomo, Raffaele Viglianti, and Michel Dumontier. 2016. “Decentralized Provenance-Aware Publishing with Nanopublications.” PeerJ Computer Science 2 (August). PeerJ: e78. doi:10.7717/peerj-cs.78.
Larivière, Vincent, Stefanie Haustein, and Philippe Mongeon. 2015. “The Oligopoly of Academic Publishers in the Digital Era.” PLOS ONE 10 (6). Public Library of Science (PLoS): e0127502. doi:10.1371/journal.pone.0127502.
Mahoney, Michael J. 1977. “Publication Prejudices: An Experimental Study of Confirmatory Bias in the Peer Review System.” Cognitive Therapy and Research 1 (2). Springer Nature: 161–75. doi:10.1007/bf01173636.
Morel, Carlos Medicis, Suzanne Jacob Serruya, Gerson Oliveira Penna, and Reinaldo Guimarães. 2009. “Co-Authorship Network Analysis: A Powerful Tool for Strategic Planning of Research, Development and Capacity Building Programs on Neglected Diseases.” Edited by MarcelEditor Tanner. PLoS Neglected Tropical Diseases 3 (8). Public Library of Science (PLoS): e501. doi:10.1371/journal.pntd.0000501.
Nielsen, Michael. 2012. Reinventing Discover: The New Era of Networked Science. Princeton University Press.
Nosek, Brian A., Charles R. Ebersole, Alexander C. DeHaven, and David T. Mellor. 2018. “The Preregistration Revolution.” Proceedings of the National Academy of Sciences 115 (11). Proceedings of the National Academy of Sciences: 2600–2606. doi:10.1073/pnas.1708274114.
Ogden, Maxwell. 2017. “Dat - Distributed Dataset Synchronization and Versioning,” January. Center for Open Science. doi:10.31219/osf.io/nsv2c.
Prathap, Gangan, S. Mini, and P. Nishy. 2016. “Does High Impact Factor Successfully Predict Future Citations? An Analysis Using Peirce’s Measure.” Scientometrics 108 (3). Springer Nature: 1043–7. doi:10.1007/s11192-016-2034-y.
Reich, Vicky, and David S. H. Rosenthal. 2001. “LOCKSS.” D-Lib Magazine 7 (6). CNRI Acct. doi:10.1045/june2001-reich.
Roosendaal, Hans E, and Peter A Th M Geurts. 1998. “Forces and Functions in Scientific Communication: An Analysis of Their Interplay.” http://web.archive.org/web/20180223112609/http://www.physik.uni-oldenburg.de/conferences/crisp97/roosendaal.html.
Seeber, Marco, Mattia Cattaneo, Michele Meoli, and Paolo Malighetti. 2017. “Self-Citations as Strategic Response to the Use of Metrics for Career Decisions.” Research Policy, December. Elsevier BV. doi:10.1016/j.respol.2017.12.004.
Seglen, P. O. 1992. “The skewness of science.” Journal of the American Society for Information Science 43: 628–38.
Seglen, P. 1994. “Causal relationship between article citedness and journal impact.” Journal of the American Society for Information Science, 45: 1–11.
Sompel, Herbert Van de, Sandy Payette, John Erickson, Carl Lagoze, and Simeon Warner. 2004. “Rethinking Scholarly Communication.” D-Lib Magazine 10 (9). CNRI Acct. doi:10.1045/september2004-vandesompel.
Tennant, Jonathan P., Jonathan M. Dugan, Daniel Graziotin, Damien C. Jacques, François Waldner, Daniel Mietchen, Yehia Elkhatib, et al. 2017. “A Multi-Disciplinary Perspective on Emergent and Future Innovations in Peer Review.” F1000Research 6 (November). F1000 Research, Ltd.: 1151. doi:10.12688/f1000research.12037.3.
“The Impact Factor Game.” 2006. PLoS Medicine 3 (6). Public Library of Science (PLoS): e291. doi:10.1371/journal.pmed.0030291.
Velterop, Jan. 2010. “Nanopublications the Future of Coping with Information Overload.” Logos 21 (3). Brill Academic Publishers: 119–22. doi:10.1163/095796511x560006.
Wasserman, Stanley, and Katherine Faust. 1994. Social Network Analysis: Methods and Applications (Structural Analysis in the Social Sciences). Cambridge University Press.
Wilsdon, James, Liz Allen, Eleonora Belfiore, Philip Campbell, Stephen Curry, Steven Hill, Richard Jones, et al. 2015. “The Metric Tide: Report of the Independent Review of the Role of Metrics in Research Assessment and Management,” July.