A Examining statistical properties of the Fisher test
The Fisher test to detect false negatives is only useful if it is powerful enough to detect evidence of at least one false negative result in papers with few nonsignificant results. Therefore we examined the specificity and sensitivity of the Fisher test to test for false negatives, with a simulation study of the one sample \(t\)-test. Throughout this chapter, we apply the Fisher test with \(\alpha_{Fisher}=0.10\), because tests that inspect whether results are “too good to be true” typically also use alpha levels of 10% (Sterne, Gavaghan, and Egger 2000; Ioannidis and Trikalinos 2007; Francis 2012). The simulation procedure was carried out for conditions in a three-factor design, where power of the Fisher test was simulated as a function of sample size \(N\), effect size \(\eta\), and \(k\) test results. The three factor design was a 3 (sample size \(N\): 33, 62, 119) by 100 (effect size \(\eta\): .00, .01, .02, …, .99) by 18 (\(k\) test results: 1, 2, 3, …, 10, 15, 20, …, 50) design, resulting in 5,400 conditions. The levels for sample size were determined based on the 25th, 50th, and 75th percentile for the degrees of freedom (\(df2\)) in the observed dataset for Application 1. Each condition contained 10,000 simulations. The power of the Fisher test for one condition was calculated as the proportion of significant Fisher test results given \(\alpha_{Fisher}=0.10\). If the power for a specific effect size \(\eta\) was \(\geq99.5\%\), power for larger effect sizes were set to 1.
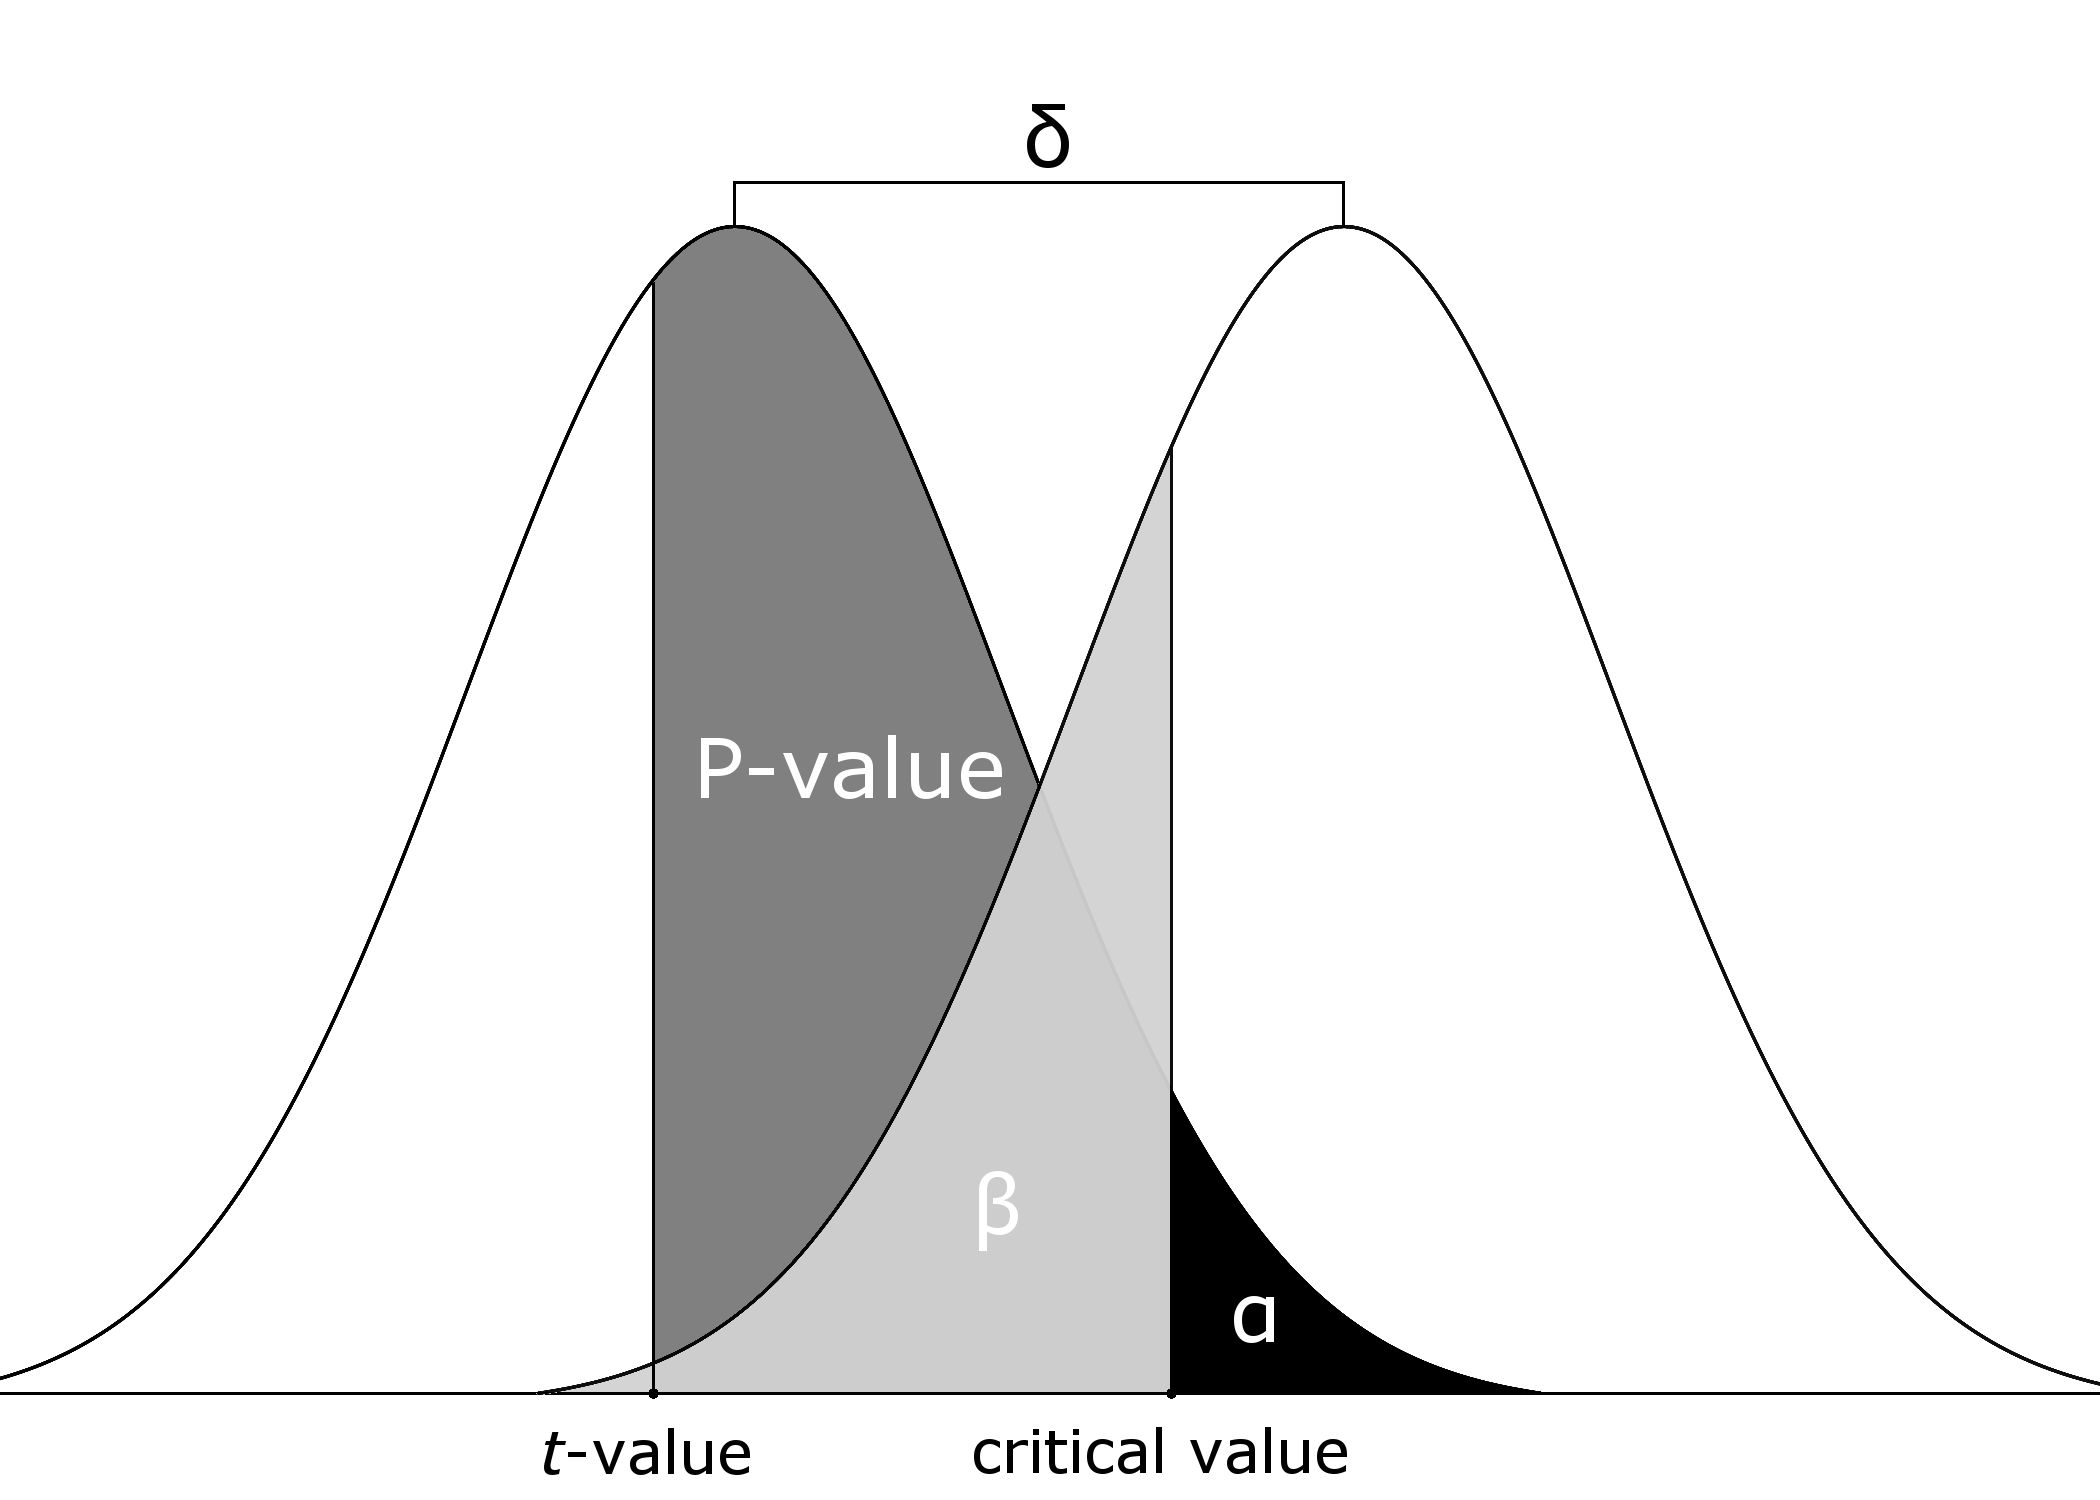
We simulated false negative \(p\)-values according to the following six steps (see Figure A.1. First, we determined the critical value under the null distribution. Second, we determined the distribution under the alternative hypothesis by computing the non-centrality parameter as \(\delta=(\eta^2/1-\eta^2)N\) (Steiger and Fouladi 1997; Smithson 2001). Third, we calculated the probability that a result under the alternative hypothesis was, in fact, nonsignificant (i.e., \(\beta\)). Fourth, we randomly sampled, uniformly, a value between \(0-\beta\). Fifth, with this value we determined the accompanying \(t\)-value. Finally, we computed the \(p\)-value for this \(t\)-value under the null distribution.

Figure A.1: Visual aid for simulating one nonsignificant test result. The critical value from \(H_0\) (left distribution) was used to determine \(\beta\) under \(H_1\) (right distribution). A value between 0 and \(\beta\) was drawn, \(t\)-value computed, and \(p\)-value under \(H_0\) determined.
We repeated the procedure to simulate a false negative \(p\)-value \(k\) times and used the resulting \(p\)-values to compute the Fisher test. Before computing the Fisher test statistic, the nonsignificant \(p\)-values were transformed (see Equation (4.1)). Subsequently, we computed the Fisher test statistic and the accompanying \(p\)-value according to Equation (4.2).
References
Francis, Gregory. 2012. “Too Good to Be True: Publication Bias in Two Prominent Studies from Experimental Psychology.” Psychonomic Bulletin & Review 19 (2). Springer Nature: 151–56. doi:10.3758/s13423-012-0227-9.
Ioannidis, John PA, and Thomas A Trikalinos. 2007. “An Exploratory Test for an Excess of Significant Findings.” Clinical Trials: Journal of the Society for Clinical Trials 4 (3). SAGE Publications: 245–53. doi:10.1177/1740774507079441.
Smithson, Michael. 2001. “Correct Confidence Intervals for Various Regression Effect Sizes and Parameters: The Importance of Noncentral Distributions in Computing Intervals.” Educational and Psychological Measurement 61 (4). SAGE Publications: 605–32. doi:10.1177/00131640121971392.
Steiger, James H, and Rachel T Fouladi. 1997. “Noncentrality interval estimation and the evaluation of statistical models.” In What If There Were No Significance Tests, edited by Lisa L. Harlow, Stanley A. Mulaik, and James H Steiger. New York, NY: Psychology Press.
Sterne, Jonathan A.C, David Gavaghan, and Matthias Egger. 2000. “Publication and Related Bias in Meta-Analysis.” Journal of Clinical Epidemiology 53 (11). Elsevier BV: 1119–29. doi:10.1016/s0895-4356(00)00242-0.