4 Too good to be false: Nonsignificant results revisited
Popper (2002) falsifiability serves as one of the main demarcating criteria in the social sciences, which stipulates that a hypothesis is required to have the possibility of being proven false to be considered scientific. Within the theoretical framework of scientific hypothesis testing, accepting or rejecting a hypothesis is unequivocal, because the hypothesis is either true or false. Statistical hypothesis testing, on the other hand, is a probabilistic operationalization of scientific hypothesis testing (Meehl 2004) and, in lieu of its probabilistic nature, is subject to decision errors. Such decision errors are the topic of this chapter.
Null Hypothesis Significance Testing (NHST) is the most prevalent paradigm for statistical hypothesis testing in the social sciences (American Psychological Association 2010b). In NHST the hypothesis \(H_0\) is tested, where \(H_0\) most often regards the absence of an effect. If deemed false, an alternative, mutually exclusive hypothesis \(H_1\) is accepted. These decisions are based on the \(p\)-value; the probability of the sample data, or more extreme data, given \(H_0\) is true. If the \(p\)-value is smaller than the decision criterion \(\alpha\) (typically .05; Nuijten, Hartgerink, et al. 2015), \(H_0\) is rejected and \(H_1\) is accepted.
Table 4.1 summarizes the four possible situations that can occur in NHST. The columns indicate which hypothesis is true in the population and the rows indicate what is decided based on the sample data. When there is discordance between the true- and decided hypothesis, a decision error is made. More specifically, when \(H_0\) is true in the population, but \(H_1\) is accepted (\('H_1'\)), a Type I error is made (\(\alpha\)); a false positive (lower left cell). When \(H_1\) is true in the population and \(H_0\) is accepted (\('H_0'\)), a Type II error is made (\(\beta\)); a false negative (upper right cell). However, when the null hypothesis is true in the population and \(H_0\) is accepted (\('H_0'\)), this is a true negative (upper left cell; \(1-\alpha\)). The true negative rate is also called specificity of the test. Conversely, when the alternative hypothesis is true in the population and \(H_1\) is accepted (\('H_1'\)), this is a true positive (lower right cell). The probability of finding a statistically significant result if \(H_1\) is true is the power (\(1-\beta\)), which is also called the sensitivity of the test. Power is a positive function of the (true) population effect size, the sample size, and the alpha of the study, such that higher power can always be achieved by altering either the sample size or the alpha level (Aberson 2010).
| \(H_0\) | \(H_1\) | ||
|---|---|---|---|
| Decision | \(’H_0’\) | \(1-\alpha\), true negative | \(\beta\), false negative [Type II error] |
| \(’H_1’\) | \(\alpha\), false positive [Type I error] | \(1-\beta\), true positive |
Unfortunately, NHST has led to many misconceptions and misinterpretations (Goodman 2008; Bakan 1966). The most serious mistake relevant to our chapter is that many researchers accept the null-hypothesis and claim no effect in case of a statistically nonsignificant effect (about 60%, see Hoekstra et al. 2006). Hence, most researchers overlook that the outcome of hypothesis testing is probabilistic (if the null-hypothesis is true, or the alternative hypothesis is true and power is less than 1) and interpret outcomes of hypothesis testing as reflecting the absolute truth. At least partly because of mistakes like this, many researchers ignore the possibility of false negatives and false positives and they remain pervasive in the literature.
Recent debate about false positives has received much attention in science and psychological science in particular. The Reproducibility Project Psychology (RPP), which replicated 100 effects reported in prominent psychology journals in 2008, found that only 36% of these effects were statistically significant in the replication (Open Science Collaboration 2015). Besides in psychology, reproducibility problems have also been indicated in economics (Camerer et al. 2016) and medicine (Begley and Ellis 2012). Although these studies suggest substantial evidence of false positives in these fields, replications show considerable variability in resulting effect size estimates (R. A. Klein et al. 2014; Stanley and Spence 2014). Therefore caution is warranted when wishing to draw conclusions on the presence of an effect in individual (original or replication) studies (Open Science Collaboration 2015; Gilbert et al. 2016; Anderson et al. 2016).
The debate about false positives is driven by the current overemphasis on statistical significance of research results (Giner-Sorolla 2012). This overemphasis is substantiated by the finding that more than 90% of results in the psychological literature are statistically significant (Open Science Collaboration 2015; Sterling, Rosenbaum, and Weinkam 1995; Sterling 1959) despite low statistical power due to small sample sizes (Cohen 1962; Sedlmeier and Gigerenzer 1989; Marszalek et al. 2011; Bakker, Dijk, and Wicherts 2012). Consequently, publications have become biased by overrepresenting statistically significant results (Greenwald 1975), which generally results in effect size overestimation in both individual studies (Nuijten, Hartgerink, et al. 2015) and meta-analyses (Van Assen, Van Aert, and Wicherts 2015; Lane and Dunlap 1978; Rothstein 2005; Borenstein et al. 2011). The overemphasis on statistically significant effects has been accompanied by questionable research practices (QRPs; John, Loewenstein, and Prelec 2012) such as erroneously rounding p-values towards significance, which for example occurred for 13.8% of all \(p\)-values reported as “\(p =.05\)” in articles from eight major psychology journals in the period 1985-2013 (Hartgerink et al. 2016).
The concern for false positives has overshadowed the concern for false negatives in the recent debate, which seems unwarranted. Cohen (1962) was the first to indicate that psychological science was (severely) underpowered, which is defined as the chance of finding a statistically significant effect in the sample being lower than 50% when there is truly an effect in the population. This has not changed throughout the subsequent fifty years (Bakker, Dijk, and Wicherts 2012; Fraley and Vazire 2014). Given that the complement of true positives (i.e., power) are false negatives, no evidence either exists that the problem of false negatives has been resolved in psychology. Moreover, Fiedler, Kutzner, and Krueger (Fiedler, Kutzner, and Krueger 2012) expressed the concern that an increased focus on false positives is too shortsighted because false negatives are more difficult to detect than false positives. They also argued that, because of the focus on statistically significant results, negative results are less likely to be the subject of replications than positive results, decreasing the probability of detecting a false negative. Additionally, the Positive Predictive Value (PPV, the number of statistically significant effects that are true; Ioannidis 2005) has been a major point of discussion in recent years, whereas the Negative Predictive Value (NPV) has rarely been mentioned.
The research objective of the current chapter is to examine evidence for false negative results in the psychology literature. To this end, we inspected a large number of nonsignificant results from eight flagship psychology journals. First, we compared the observed effect distributions of nonsignificant results for eight journals (combined and separately) to the expected null distribution based on simulations, where a discrepancy between observed and expected distribution was anticipated (i.e., presence of false negatives). Second, we propose to use the Fisher test to test the hypothesis that \(H_0\) is true for all nonsignificant results reported in a paper, which we show to have high power to detect false negatives in a simulation study. Third, we applied the Fisher test to the nonsignificant results in 14,765 psychology papers from these eight flagship psychology journals to inspect how many papers show evidence of at least one false negative result. Fourth, we examined evidence of false negatives in reported gender effects. Gender effects are particularly interesting, because gender is typically a control variable and not the primary focus of studies. Hence we expect little \(p\)-hacking and substantial evidence of false negatives in reported gender effects in psychology. Finally, as another application, we applied the Fisher test to the 64 nonsignificant replication results of the RPP (Open Science Collaboration 2015) to examine whether at least one of these nonsignificant results may actually be a false negative.
4.1 Theoretical framework
We begin by reviewing the probability density function of both an individual \(p\)-value and a set of independent \(p\)-values as a function of population effect size. Subsequently, we apply the Kolmogorov-Smirnov test to inspect whether a collection of nonsignificant results across papers deviates from what would be expected under the \(H_0\). We also propose an adapted Fisher method to test whether nonsignificant results deviate from \(H_0\) within a paper. These methods will be used to test whether there is evidence for false negatives in the psychology literature.
4.1.1 Distributions of p-values
The distribution of one \(p\)-value is a function of the population effect, the observed effect and the precision of the estimate. When the population effect is zero, the probability distribution of one \(p\)-value is uniform. When there is a non-zero effect, the probability distribution is right-skewed. More specifically, as sample size or true effect size increases, the probability distribution of one \(p\)-value becomes increasingly right-skewed. These regularities also generalize to a set of independent \(p\)-values, which are uniformly distributed when there is no population effect and right-skew distributed when there is a population effect, with more right-skew as the population effect and/or precision increases (Fisher 1925).
Considering that the present chapter focuses on false negatives, we primarily examine nonsignificant \(p\)-values and their distribution. Since the test we apply is based on nonselected \(p\)-values, it requires random variables distributed between 0 and 1. We apply the following transformation to each nonsignificant \(p\)-value that is selected \[\begin{equation} p^*_i=\frac{p_i-\alpha}{1-\alpha} \tag{4.1} \end{equation}\]where \(p_i\) is the reported nonsignificant \(p\)-value, \(\alpha\) is the selected significance cutoff (i.e., \(\alpha=.05\)), and \(p^*_i\) the transformed \(p\)-value. Note that this transformation retains the distributional properties of the original \(p\)-values for the selected nonsignificant results. Both one-tailed and two-tailed tests can be included in this way.
4.1.2 Testing for false negatives: the Fisher test
We applied the Fisher test to inspect whether the distribution of observed nonsignificant \(p\)-values deviates from those expected under \(H_0\). The Fisher test was initially introduced as a meta-analytic technique to synthesize results across studies (Fisher 1925; Hedges and Olkin 1985). When applied to transformed nonsignificant \(p\)-values (see Equation (4.1)) the Fisher test tests for evidence against \(H_0\) in a set of nonsignificant \(p\)-values. In other words, the null hypothesis we test with the Fisher test is that all included nonsignificant results are true negatives. The Fisher test statistic is calculated as \[\begin{equation} \chi^2_{2k}=-2\sum\limits^k_{i=1}ln(p^*_i) \tag{4.2} \end{equation}\]where \(k\) is the number of nonsignificant \(p\)-values and \(\chi^2\) has \(2k\) degrees of freedom. A larger \(\chi^2\) value indicates more evidence for at least one false negative in the set of \(p\)-values. We conclude that there is sufficient evidence of at least one false negative result, if the Fisher test is statistically significant at \(\alpha=.10\), similar to tests of publication bias that also use \(\alpha=.10\) (Sterne, Gavaghan, and Egger 2000; Ioannidis and Trikalinos 2007; Francis 2012).
We estimated the power of detecting false negatives with the Fisher test as a function of sample size \(N\), true correlation effect size \(\eta\), and \(k\) nonsignificant test results (the full procedure is described in Appendix A). The three levels of sample size used in our simulation study (33, 62, 119) correspond to the 25th, 50th (median) and 75th percentiles of the degrees of freedom of reported \(t\), \(F\), and \(r\) statistics in eight flagship psychology journals (see Application 1 below). Degrees of freedom of these statistics are directly related to sample size, for instance, for a two-group comparison including 100 people, df = 98.
Table 4.2 summarizes the results for the simulations of the Fisher test when the nonsignificant \(p\)-values are generated by either small- or medium population effect sizes. Results for all 5,400 conditions can be found on the OSF (osf.io/qpfnw). The results indicate that the Fisher test is a powerful method to test for a false negative among nonsignificant results. For example, for small true effect sizes (\(\eta=.1\)), 25 nonsignificant results from medium samples result in 85% power (7 nonsignificant results from large samples yield 83% power). For medium true effects (\(\eta=.25\)), three nonsignificant results from small samples (\(N=33\)) already provide 89% power for detecting a false negative with the Fisher test. For large effects (\(\eta=.4\)), two nonsignificant results from small samples already almost always detects the existence of false negatives (not shown in Table 4.2).
| \(N=33\) | \(N=62\) | \(N=119\) | \(N=33\) | \(N=62\) | \(N=119\) | |
|---|---|---|---|---|---|---|
| \(k = 1\) | 0.151 | 0.211 | 0.341 | 0.575 | 0.852 | 0.983 |
| \(k = 2\) | 0.175 | 0.267 | 0.459 | 0.779 | 0.978 | 1.000 |
| \(k = 3\) | 0.201 | 0.317 | 0.572 | 0.894 | 1.000 | 1.000 |
| \(k = 4\) | 0.208 | 0.352 | 0.659 | 0.948 | 1.000 | 1.000 |
| \(k = 5\) | 0.229 | 0.390 | 0.719 | 0.975 | 1.000 | 1.000 |
| \(k = 6\) | 0.251 | 0.434 | 0.784 | 0.990 | 1.000 | 1.000 |
| \(k = 7\) | 0.259 | 0.471 | 0.834 | 0.995 | 1.000 | 1.000 |
| \(k = 8\) | 0.280 | 0.514 | 0.871 | 0.998 | 1.000 | 1.000 |
| \(k = 9\) | 0.298 | 0.530 | 0.895 | 1.000 | 1.000 | 1.000 |
| \(k = 10\) | 0.304 | 0.570 | 0.918 | 1.000 | 1.000 | 1.000 |
| \(k = 15\) | 0.362 | 0.691 | 0.980 | 1.000 | 1.000 | 1.000 |
| \(k = 20\) | 0.429 | 0.780 | 0.996 | 1.000 | 1.000 | 1.000 |
| \(k = 25\) | 0.490 | 0.852 | 1.000 | 1.000 | 1.000 | 1.000 |
| \(k = 30\) | 0.531 | 0.894 | 1.000 | 1.000 | 1.000 | 1.000 |
| \(k = 35\) | 0.578 | 0.930 | 1.000 | 1.000 | 1.000 | 1.000 |
| \(k = 40\) | 0.621 | 0.953 | 1.000 | 1.000 | 1.000 | 1.000 |
| \(k = 45\) | 0.654 | 0.966 | 1.000 | 1.000 | 1.000 | 1.000 |
| \(k = 50\) | 0.686 | 0.976 | 1.000 | 1.000 | 1.000 | 1.000 |
To put the power of the Fisher test into perspective, we can compare its power to reject the null based on one statistically nonsignificant result (\(k=1\)) with the power of a regular \(t\)-test to reject the null. If \(\eta=.1\), the power of a regular \(t\)-test equals 0.17, 0.255, 0.467 for sample sizes of 33, 62, 119, respectively; if \(\eta\) = .25, power values equal 0.813, 0.998, 1 for these sample sizes. The power values of the regular \(t\)-test are higher than that of the Fisher test, because the Fisher test does not make use of the more informative statistically significant findings.
4.2 Application 1: Evidence of false negatives in articles across eight major psychology journals
To show that statistically nonsignificant results do not warrant the interpretation that there is truly no effect, we analyzed statistically nonsignificant results from eight major psychology journals. First, we investigate if and how much the distribution of reported nonsignificant effect sizes deviates from what the expected effect size distribution is if there is truly no effect (i.e., \(H_0\)). Second, we investigate how many research articles report nonsignificant results and how many of those show evidence for at least one false negative using the Fisher test (Fisher 1925). Note that this application only investigates the evidence of false negatives in articles, not how authors might interpret these findings (i.e., we do not assume all these nonsignificant results are interpreted as evidence for the null).
4.2.1 Method
APA style \(t\), \(r\), and \(F\) test statistics were extracted from eight psychology journals with the R package statcheck (Nuijten, Hartgerink, et al. 2015; Epskamp and Nuijten 2016). APA style is defined as the format where the type of test statistic is reported, followed by the degrees of freedom (if applicable), the observed test value, and the \(p\)-value (e.g., \(t(85)=2.86, p=.005\); American Psychological Association 2010b). The statcheck package also recalculates \(p\)-values. We reuse the data from Nuijten et al. (https://osf.io/gdr4q; Nuijten, Hartgerink, et al. 2015). Table 4.3 depicts the journals, the timeframe, and summaries of the results extracted. The database also includes \(\chi^2\) results, which we did not use in our analyses because effect sizes based on these results are not readily mapped on the correlation scale. Two erroneously reported test statistics were eliminated, such that these did not confound results.
The analyses reported in this chapter use the recalculated \(p\)-values to eliminate potential errors in the reported \(p\)-values (Bakker and Wicherts 2011; Nuijten, Hartgerink, et al. 2015). However, our recalculated \(p\)-values assumed that all other test statistics (degrees of freedom, test values of \(t\), \(F\), or \(r\)) are correctly reported. These errors may have affected the results of our analyses. Since most \(p\)-values and corresponding test statistics were consistent in our dataset (90.7%), we do not believe these typing errors substantially affected our results and conclusions based on them.
| Journal Acronym | Time frame | Results | Mean results per article | Significant (%) | Nonsignificant (%) |
|---|---|---|---|---|---|
| Developmental Psychology (DP) | 1985–2013 | 30,920 | 13.5 | 24,584 (79.5%) | 6,336 (20.5%) |
| Frontiers in Psychology (FP) | 2010–2013 | 9,172 | 14.9 | 6,595 (71.9%) | 2,577 (28.1%) |
| Journal of Applied Psychology (JAP) | 1985–2013 | 11,240 | 9.1 | 8,455 (75.2%) | 2,785 (24.8%) |
| Journal of Consulting and Clinical Psychology (JCCP) | 1985–2013 | 20,083 | 9.8 | 15,672 (78.0%) | 4,411 (22.0%) |
| Journal of Experimental Psychology: General (JEPG) | 1985–2013 | 17,283 | 22.4 | 12,706 (73.5%) | 4,577 (26.5%) |
| Journal of Personality and Social Psychology (JPSP) | 1985–2013 | 91,791 | 22.5 | 69,836 (76.1%) | 21,955 (23.9%) |
| Public Library of Science (PLOS) | 2003–2013 | 28,561 | 13.2 | 19,696 (69.0%) | 8,865 (31.0%) |
| Psychological Science (PS) | 2003–2013 | 14,032 | 9 | 10,943 (78.0%) | 3,089 (22.0%) |
| Totals | 1985–2013 | 223,082 | 14.3 | 168,487 (75.5%) | 54,595 (24.5%) |
First, we compared the observed nonsignificant effect size distribution (computed with observed test results) to the expected nonsignificant effect size distribution under \(H_0\). The expected effect size distribution under \(H_0\) was approximated using simulation. We first randomly drew an observed test result (with replacement) and subsequently drew a random nonsignificant \(p\)-value between 0.05 and 1 (i.e., under the distribution of the \(H_0\)). Based on the drawn \(p\)-value and the degrees of freedom of the drawn test result, we computed the accompanying test statistic and the corresponding effect size (for details on effect size computation see Appendix A). This procedure was repeated 163,785 times, which is three times the number of observed nonsignificant test results (54,595). The collection of simulated results approximates the expected effect size distribution under \(H_0\), assuming independence of test results in the same paper. We inspected this possible dependency with the intra-class correlation (\(ICC\)), where \(ICC=1\) indicates full dependency and \(ICC=0\) indicates full independence. For the set of observed results, the ICC for nonsignificant \(p\)-values was 0.001, indicating independence of \(p\)-values within a paper (the ICC of the log odds transformed \(p\)-values was similar, with \(ICC=0.00175\) after excluding \(p\)-values equal to 1 for computational reasons). The resulting, expected effect size distribution was compared to the observed effect size distribution (i) across all journals and (ii) per journal. To test for differences between the expected and observed nonsignificant effect size distributions we applied the Kolmogorov-Smirnov test. This is a non-parametric goodness-of-fit test for equality of distributions, which is based on the maximum absolute deviation between the independent distributions being compared (denoted \(D\); Massey 1951).
Second, we applied the Fisher test to test how many research papers show evidence of at least one false negative statistical result. To recapitulate, the Fisher test tests whether the distribution of observed nonsignificant \(p\)-values deviates from the uniform distribution expected under \(H_0\). In order to compute the result of the Fisher test, we applied equations (4.1) and (4.2) to the recalculated nonsignificant \(p\)-values in each paper (\(\alpha=.05\)).
4.2.2 Results
4.2.2.1 Observed effect size distribution.
Figure 4.1 shows the distribution of observed effect sizes (in \(|\eta|\)) across all articles and indicates that, of the 223,082 observed effects, 7% were zero to small (i.e., \(0\leq|\eta|<.1\)), 23% were small to medium (i.e., \(.1\leq|\eta|<.25\)), 27% medium to large (i.e., \(.25\leq|\eta|<.4\)), and 42% large or larger (i.e., \(|\eta|\geq.4\); Cohen 1988). This suggests that the majority of effects reported in psychology is medium or smaller (i.e., 30%), which is somewhat in line with a previous study on effect distributions (Gignac and Szodorai 2016). Of the full set of 223,082 test results, 54,595 (24.5%) were nonsiginificant, which is the dataset for our main analyses.
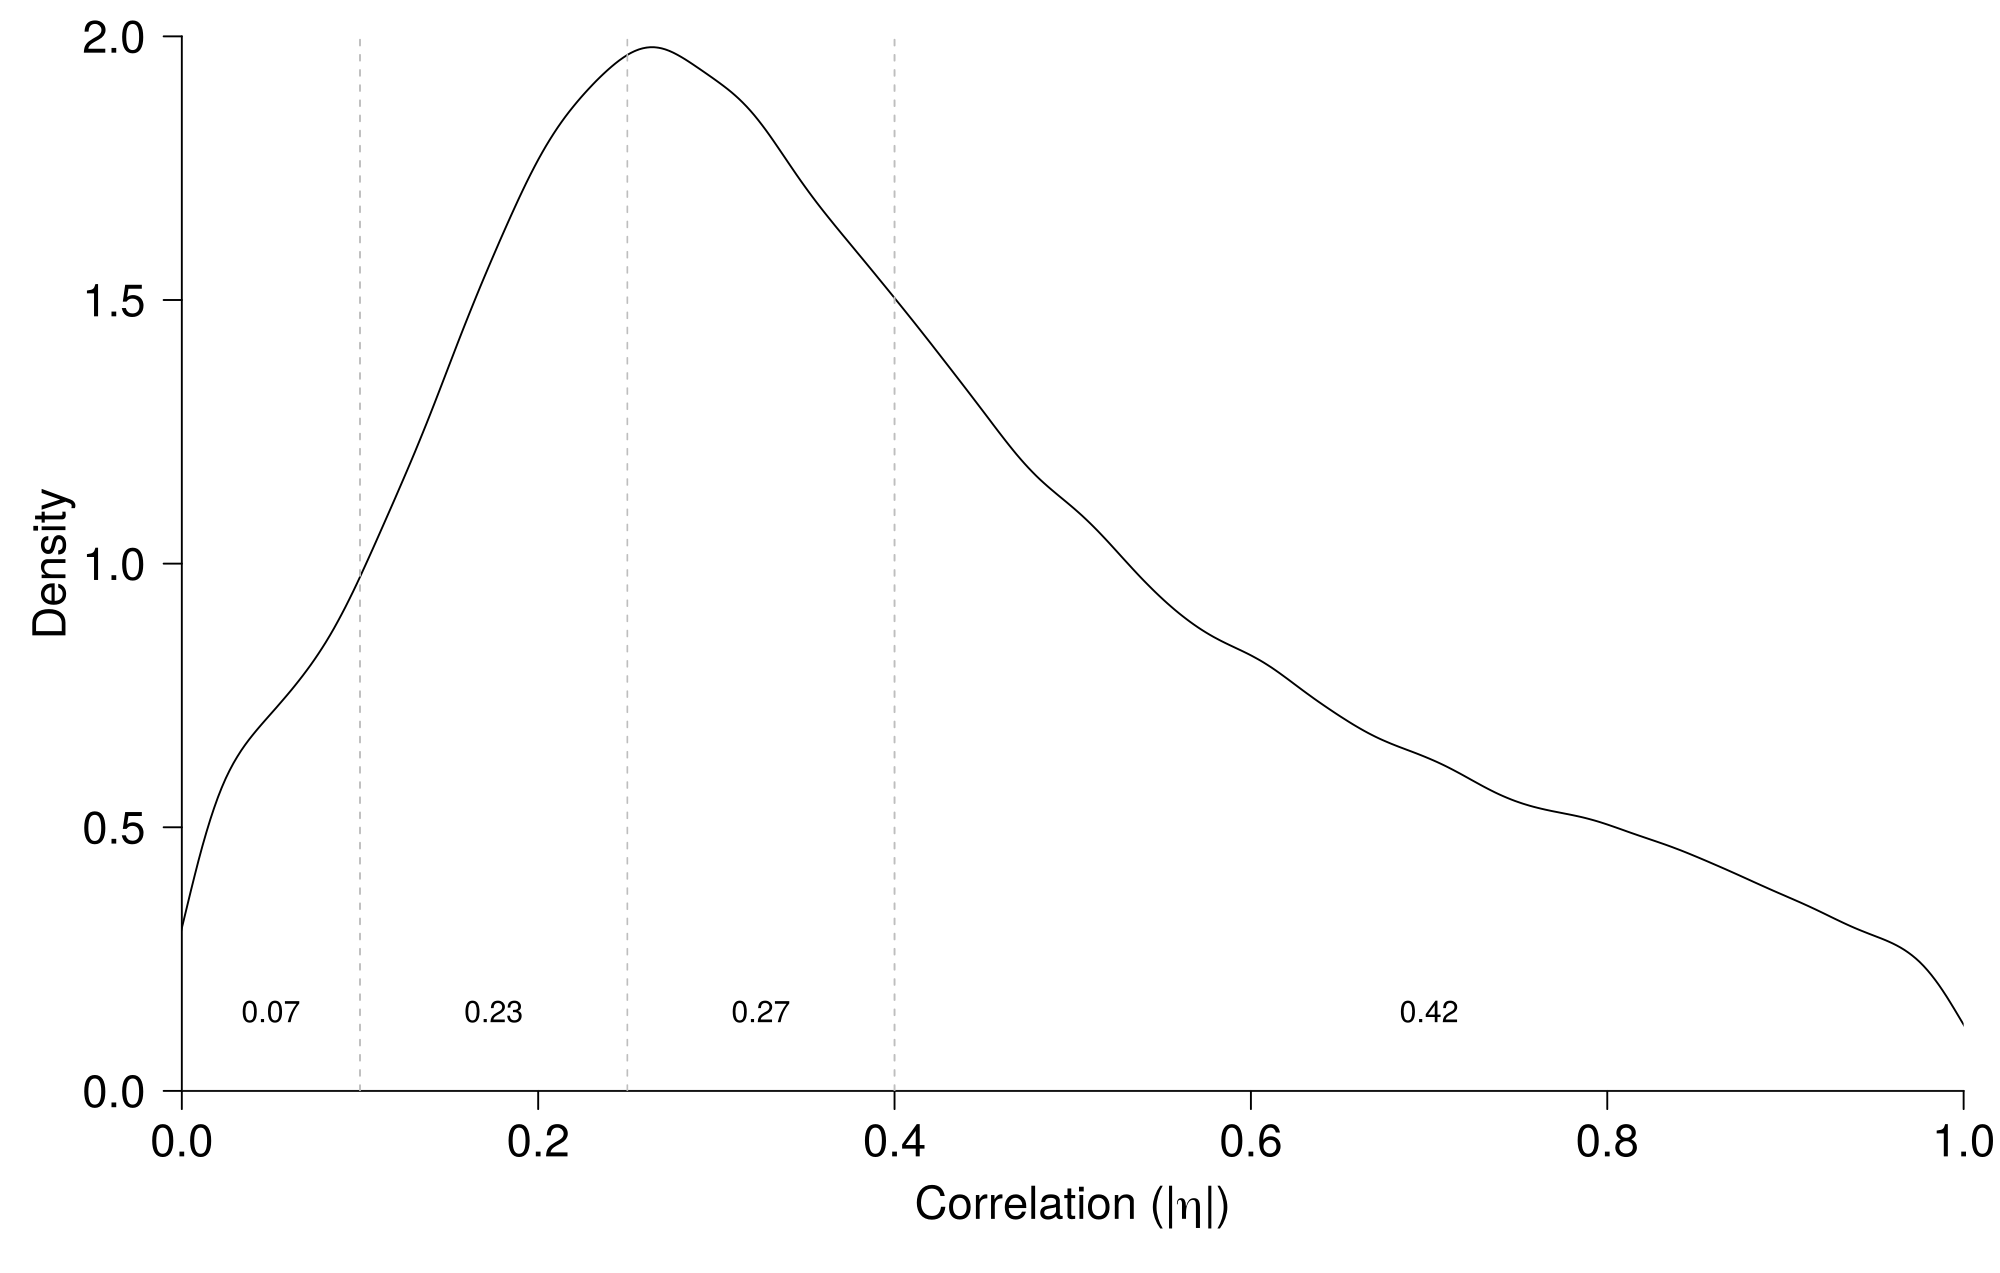
Figure 4.1: Density of observed effect sizes of results reported in eight psychology journals, with 7 percent of effects in the category none-small, 23 percent small-medium, 27 percent medium-large, and 42 percent beyond large.
Our dataset indicated that more nonsignificant results are reported throughout the years, strengthening the case for inspecting potential false negatives. The proportion of reported nonsignificant results showed an upward trend, as depicted in Figure 4.2, from approximately 20% in the eighties to approximately 30% of all reported APA results in 2015.

Figure 4.2: Observed proportion of nonsignificant test results per year.
4.2.3 Expected effect size distribution.
For the entire set of nonsignificant results across journals, Figure 4.3 indicates that there is substantial evidence of false negatives. Under \(H_0\), 46% of all observed effects is expected to be within the range \(0\leq|\eta|<.1\), as can be seen in the left panel of Figure 4.3 highlighted by the lowest grey line (dashed). However, of the observed effects, only 26% fall within this range, as highlighted by the lowest black line. Similarly, we would expect 85% of all effect sizes to be within the range \(0\leq|\eta|<.25\) (middle grey line), but we observed 14 percentage points less in this range (i.e., 71%; middle black line); 96% is expected for the range \(0\leq|\eta|<.4\) (top grey line), but we observed 4 percentage points less (i.e., 92%; top black line). These differences indicate that larger nonsignificant effects are reported in papers than expected under a null effect. This indicates the presence of false negatives, which is confirmed by the Kolmogorov-Smirnov test, \(D=0.3\), \(p<.000000000000001\). Results were similar when the nonsignificant effects were considered separately for the eight journals, although deviations were smaller for the Journal of Applied Psychology (see https://osf.io/au3wv/ for results per journal).
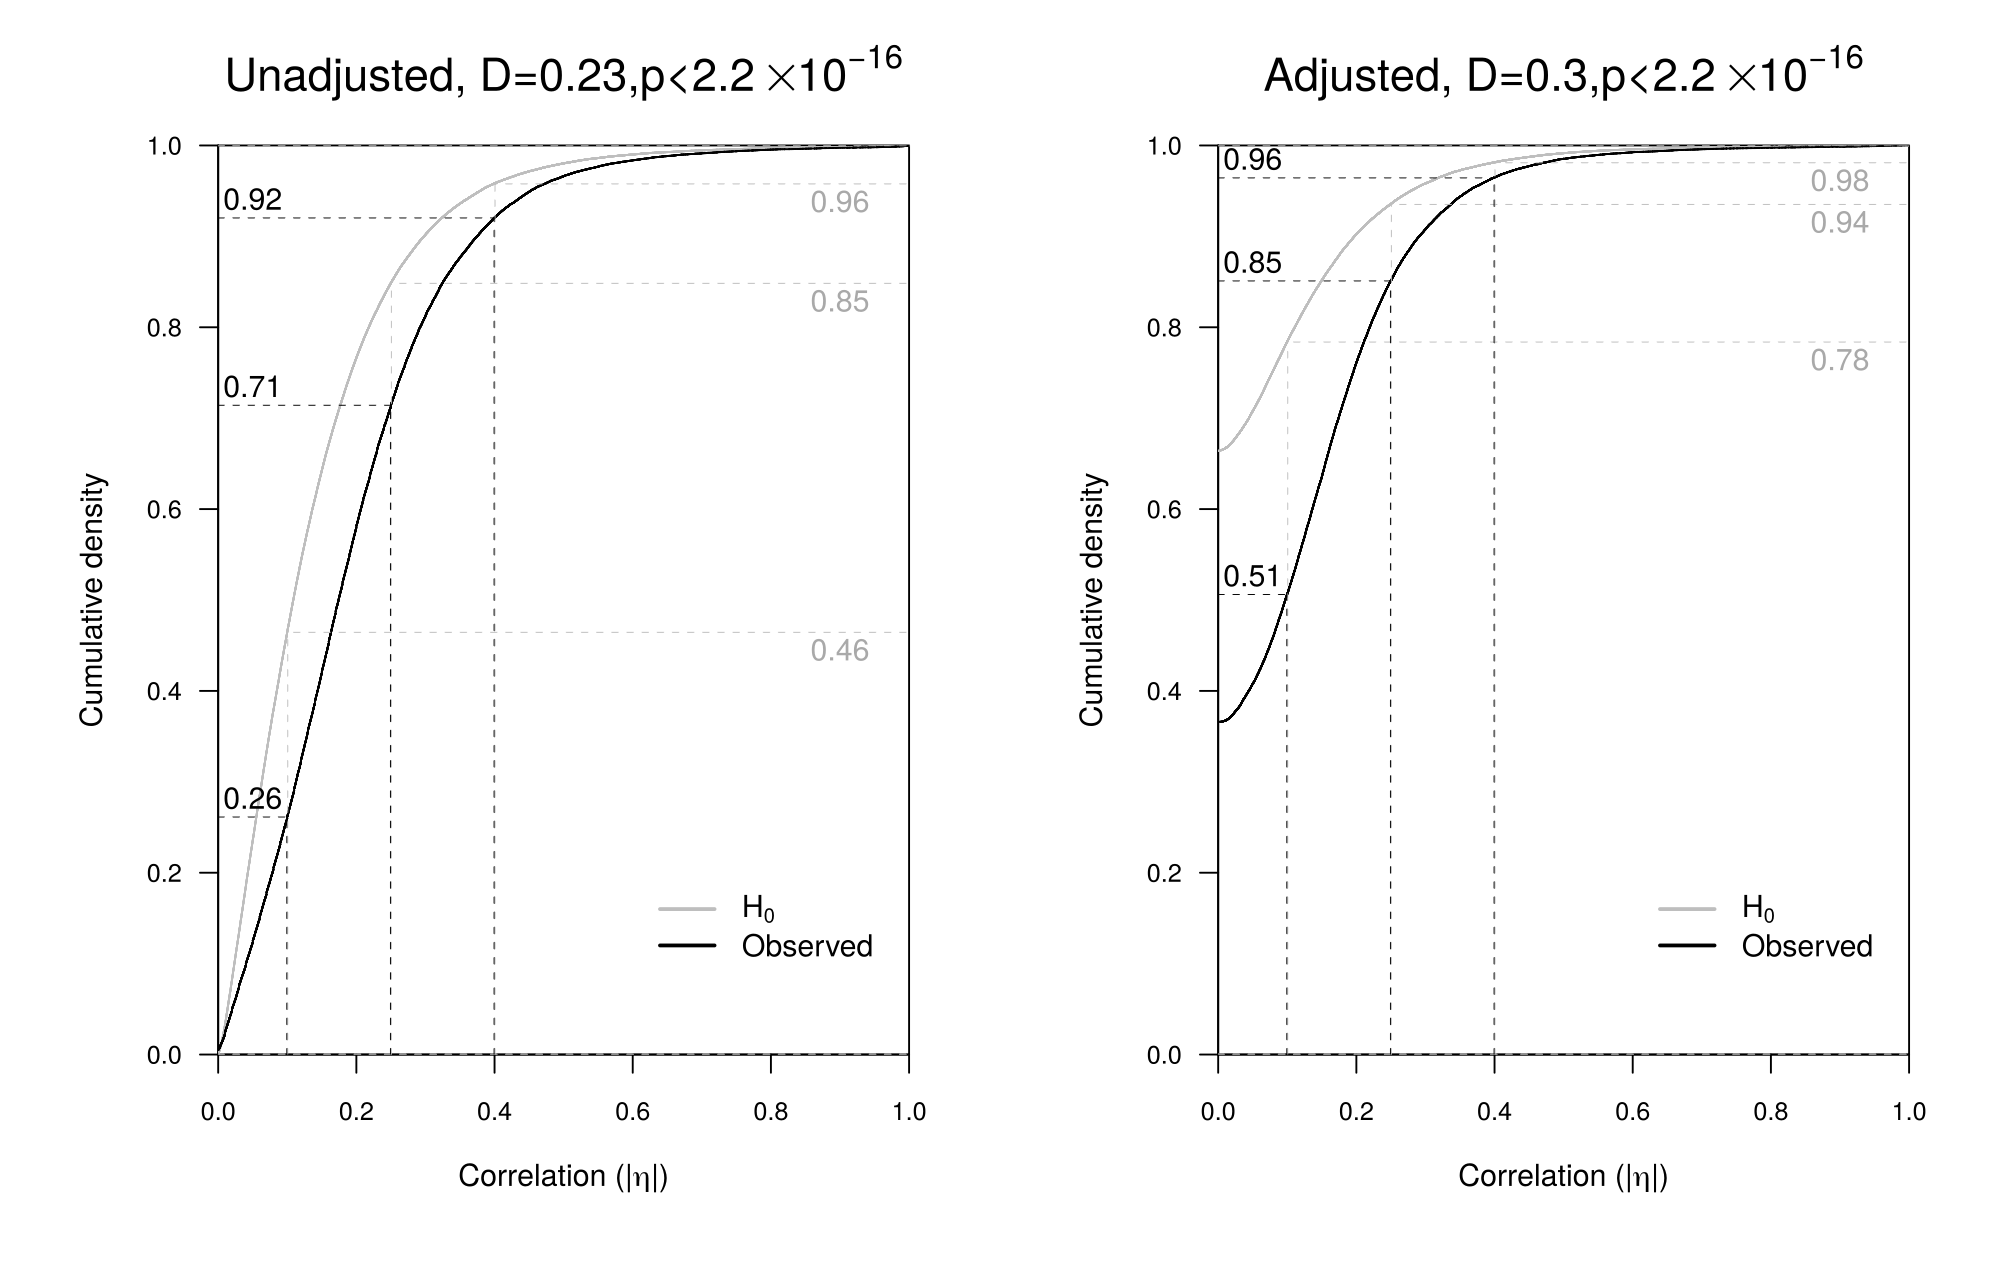
Figure 4.3: Observed and expected (adjusted and unadjusted) effect size distribution for statistically nonsignificant APA results reported in eight psychology journals. Grey lines depict expected values; black lines depict observed values. The three vertical dotted lines correspond to a small, medium, large effect, respectively. Header includes Kolmogorov-Smirnov test results.
Because effect sizes and their distribution typically overestimate population effect size \(\eta^2\), particularly when sample size is small (Voelkle, Ackerman, and Wittmann 2007; Hedges 1981), we also compared the observed and expected adjusted nonsignificant effect sizes that correct for such overestimation of effect sizes (right panel of Figure 4.3; see Appendix A). Such overestimation affects all effects in a model, both focal and non-focal. The distribution of adjusted effect sizes of nonsignificant results tells the same story as the unadjusted effect sizes; observed effect sizes are larger than expected effect sizes. For instance, the distribution of adjusted reported effect size suggests 49% of effect sizes are at least small, whereas under the \(H_0\) only 22% is expected.
4.2.4 Evidence of false negatives in articles.
The Fisher test was applied to the nonsignificant test results of each of the 14,765 papers separately, to inspect for evidence of false negatives. More technically, we inspected whether \(p\)-values within a paper deviate from what can be expected under the \(H_0\) (i.e., uniformity). If \(H_0\) is in fact true, our results would be that there is evidence for false negatives in 10% of the papers (a meta-false positive). Table 4.4 shows the number of papers with evidence for false negatives, specified per journal and per \(k\) number of nonsignificant test results. The first row indicates the number of papers that report no nonsignificant results. When \(k=1\), the Fisher test is simply another way of testing whether the result deviates from a null effect, conditional on the result being statistically nonsignificant. Overall results (last row) indicate that 47.1% of all articles show evidence of false negatives (i.e. 6,951 articles). Of articles reporting at least one nonsignificant result, 66.7% show evidence of false negatives, which is much more than the 10% predicted by chance alone. Results did not substantially differ if nonsignificance is determined based on \(\alpha=.10\) (the analyses can be rerun with any set of \(p\)-values larger than a certain value based on the code provided on OSF; https://osf.io/qpfnw.
| Overall | DP | FP | JAP | JCCP | JEPG | JPSP | PLOS | PS | ||
|---|---|---|---|---|---|---|---|---|---|---|
| Nr. of papers | 14,765 | 2,283 | 614 | 1,239 | 2,039 | 772 | 4,087 | 2,166 | 1,565 | |
| \(k=0\) | Count | 4,340 | 758 | 133 | 488 | 907 | 122 | 840 | 565 | 527 |
| % | 29.4% | 33.2% | 21.7% | 39.4% | 44.5% | 15.8% | 20.6% | 26.1% | 33.7% | |
| \(k=1\) | Evidence FN | 57.7% | 66.1% | 41.2% | 48.7% | 58.7% | 51.4% | 66.0% | 47.2% | 56.4% |
| Count | 2,510 | 433 | 102 | 238 | 380 | 109 | 556 | 339 | 353 | |
| \(k=2\) | Evidence FN | 60.6% | 66.9% | 50.0% | 36.3% | 57.7% | 66.7% | 75.2% | 51.6% | 57.1% |
| Count | 1,768 | 293 | 64 | 157 | 227 | 81 | 424 | 289 | 233 | |
| \(k=3\) | Evidence FN | 65.3% | 69.8% | 57.6% | 53.1% | 54.4% | 77.1% | 80.6% | 47.8% | 60.2% |
| Count | 1,257 | 199 | 66 | 98 | 125 | 83 | 341 | 184 | 161 | |
| \(k=4\) | Evidence FN | 68.7% | 75.0% | 63.8% | 53.1% | 69.7% | 67.9% | 81.4% | 52.7% | 62.5% |
| Count | 892 | 128 | 47 | 64 | 89 | 56 | 264 | 148 | 96 | |
| \(5\leq k\)<10 | Evidence FN | 72.3% | 71.2% | 67.7% | 56.7% | 66.3% | 71.2% | 87.1% | 52.4% | 63.0% |
| Count | 2,394 | 326 | 124 | 134 | 208 | 163 | 898 | 368 | 173 | |
| \(10\leq k\)<20 | Evidence FN | 77.7% | 76.9% | 67.7% | 60.0% | 72.4% | 81.2% | 88.1% | 57.3% | 81.0% |
| Count | 1,280 | 121 | 65 | 55 | 87 | 117 | 596 | 218 | 21 | |
| \(k\geq20\) | Evidence FN | 84.0% | 76.0% | 53.8% | 60.0% | 87.5% | 80.5% | 94.0% | 69.1% | 0.0% |
| Count | 324 | 25 | 13 | 5 | 16 | 41 | 168 | 55 | 1 | |
| All | Evidence FN | 47.1% | 46.5% | 45.1% | 29.9% | 34.3% | 59.1% | 64.6% | 38.4% | 39.3% |
| Evidence FN \(k\geq1\) | 66.7% | 69.6% | 57.6% | 49.4% | 61.7% | 70.2% | 81.3% | 51.9% | 59.2% | |
| Count | 6,951 | 1,061 | 277 | 371 | 699 | 456 | 2,641 | 831 | 615 |
Table 4.4 also shows evidence of false negatives for each of the eight journals. The lowest proportion of articles with evidence of at least one false negative was for the Journal of Applied Psychology (49.4%; penultimate row). The remaining journals show higher proportions, with a maximum of 81.3% (Journal of Personality and Social Psychology). Researchers should thus be wary to interpret negative results in journal articles as a sign that there is no effect; at least half of the papers provide evidence for at least one false negative finding.
As would be expected, we found a higher proportion of articles with evidence of at least one false negative for higher numbers of statistically nonsignificant results (\(k\); see Table 4.4). For instance, 84% of all papers that report more than 20 nonsignificant results show evidence for false negatives, whereas 57.7% of all papers with only 1 nonsignificant result show evidence for false negatives. Consequently, we observe that journals with articles containing a higher number of nonsignificant results, such as JPSP, have a higher proportion of articles with evidence of false negatives. This is the result of higher power of the Fisher method when there are more nonsignificant results and does not necessarily reflect that a nonsignificant \(p\)-value in e.g. JPSP has a higher probability of being a false negative than one in another journal.
We also checked whether evidence of at least one false negative at the article level changed over time. Figure 4.4 depicts evidence across all articles per year, as a function of year (1985-2013); point size in the figure corresponds to the mean number of nonsignificant results per article (mean \(k\)) in that year. Interestingly, the proportion of articles with evidence for false negatives decreased from 77% in 1985 to 55% in 2013, despite the increase in mean \(k\) (from 2.11 in 1985 to 4.52 in 2013). This decreasing proportion of papers with evidence over time cannot be explained by a decrease in sample size over time, as sample size in psychology articles has stayed stable across time (see Figure 4.5; degrees of freedom is a direct proxy of sample size resulting from the sample size minus the number of parameters in the model). One (at least partial) explanation of this surprising result is that in the early days researchers primarily reported fewer APA results and used to report relatively more APA results with ‘marginally significant’ \(p\)-values (i.e., \(p\)-values slightly larger than .05), compared to nowadays. This explanation is supported by both a smaller number of reported APA results in the past and the smaller mean reported nonsignificant \(p\)-value (0.222 in 1985, 0.386 in 2013). We do not know whether these marginally significant \(p\)-values were interpreted as evidence in favor of a finding (or not) and how these interpretations changed over time. Another potential explanation is that the effect sizes being studied have become smaller over time (mean correlation effect \(r=\) 0.257 in 1985, 0.187 in 2013), which results in both higher \(p\)-values over time and lower power of the Fisher test. Using the data at hand, we cannot distinguish between the two explanations.
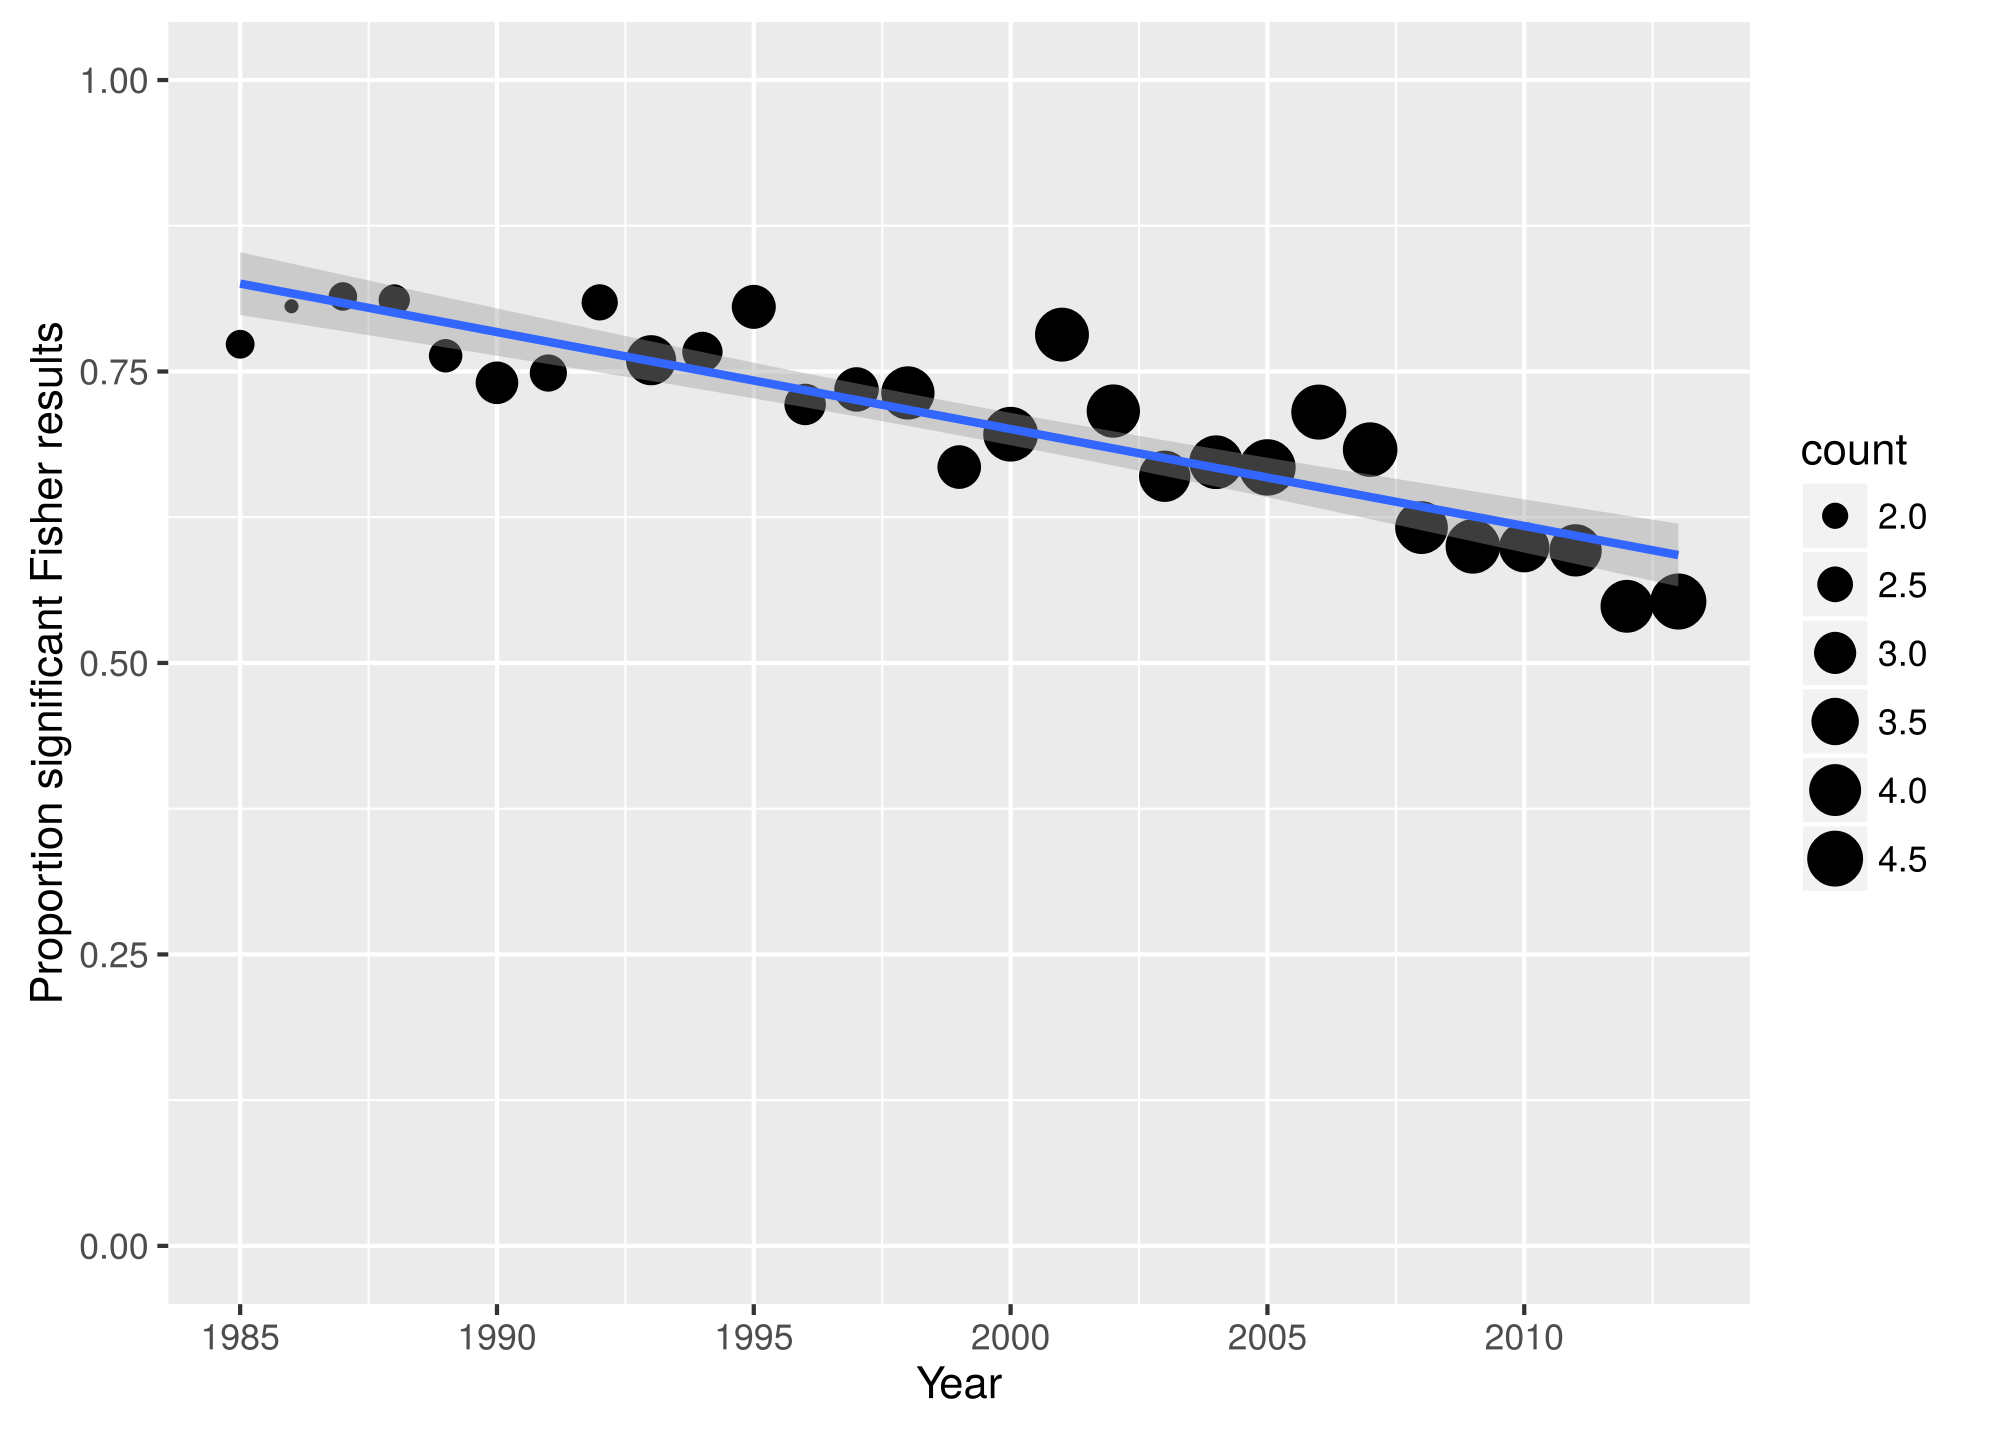
Figure 4.4: Proportion of papers reporting nonsignificant results in a given year, showing evidence for false negative results. Larger point size indicates a higher mean number of nonsignificant results reported in that year.
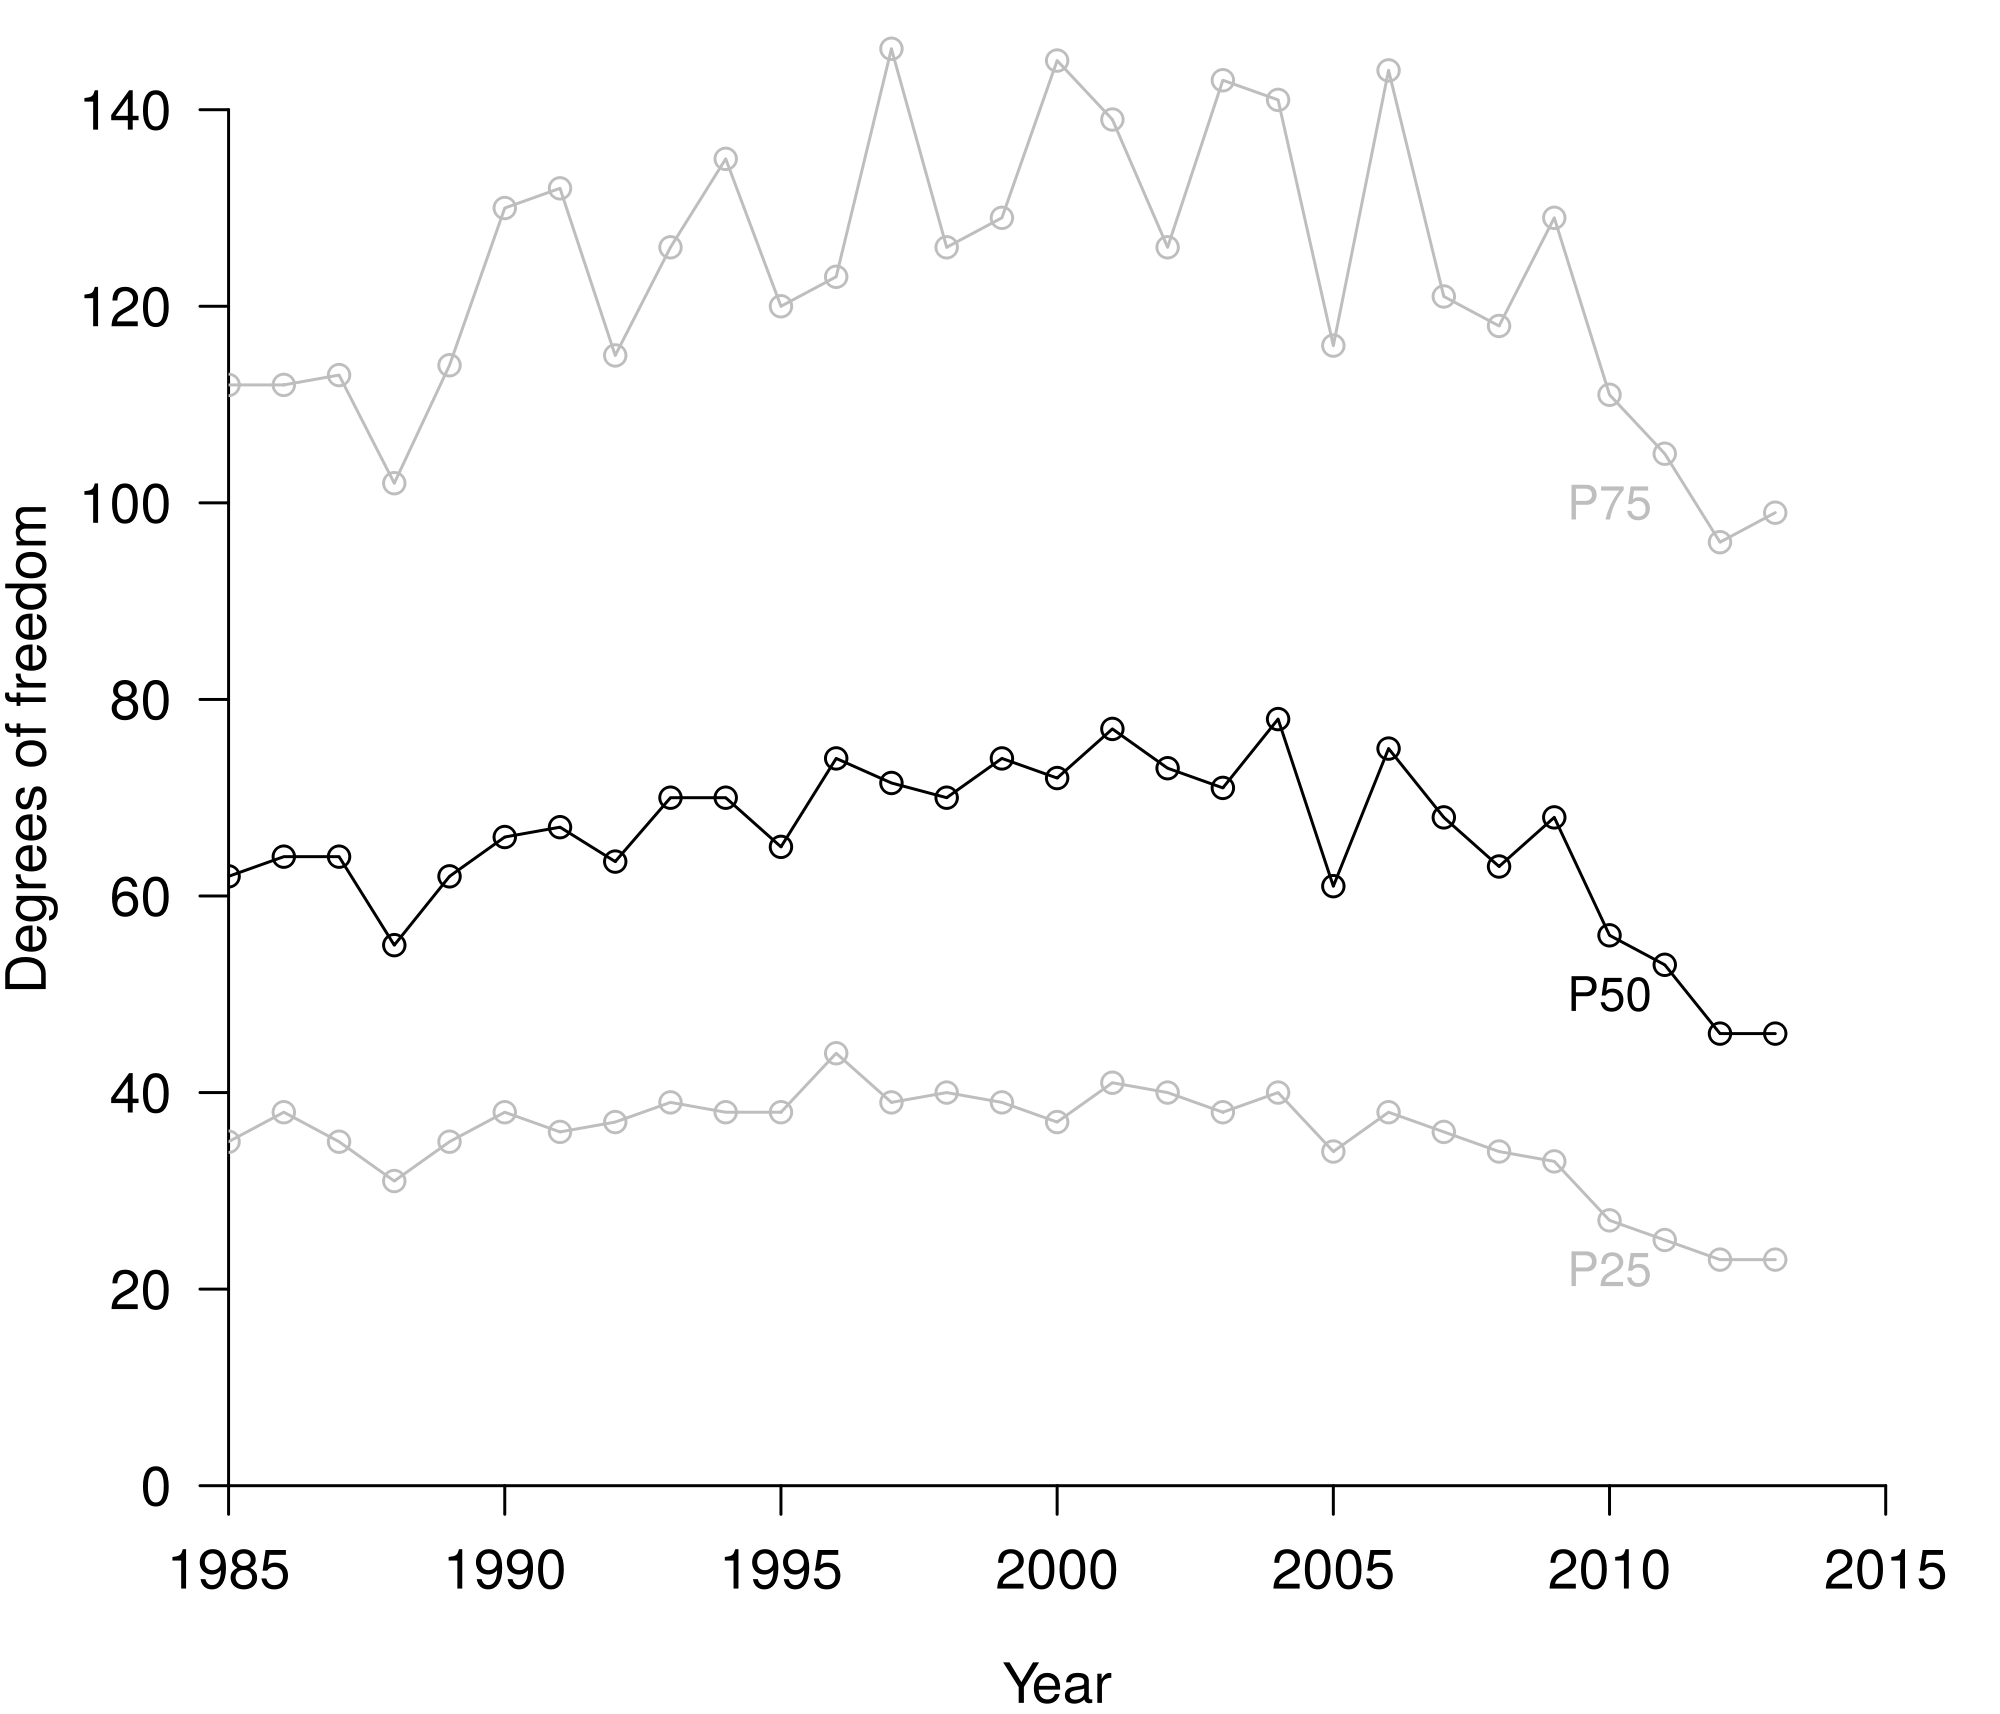
Figure 4.5: Sample size development in psychology throughout 1985-2013, based on degrees of freedom across 258,050 test results. P25 = 25th percentile. P50 = 50th percentile (i.e., median). P75 = 75th percentile.
4.2.5 Discussion
The result that 2 out of 3 papers containing nonsignificant results show evidence of at least one false negative empirically verifies previously voiced concerns about insufficient attention for false negatives (Fiedler, Kutzner, and Krueger 2012). The Fisher test proved a powerful test to inspect for false negatives in our simulation study, where three nonsignificant results already results in high power to detect evidence of a false negative if sample size is at least 33 per result and the population effect is medium. Journals differed in the proportion of papers that showed evidence of false negatives, but this was largely due to differences in the number of nonsignificant results reported in these papers. More generally, we observed that more nonsignificant results were reported in 2013 than in 1985.
The repeated concern about power and false negatives throughout the last decades seems not to have trickled down into substantial change in psychology research practice. Cohen (1962) and Sedlmeier and Gigerenzer (1989) already voiced concern decades ago and showed that power in psychology was low. Fiedler, Kutzner, and Krueger (2012) contended that false negatives are harder to detect in the current scientific system and therefore warrant more concern. Despite recommendations of increasing power by increasing sample size, we found no evidence for increased sample size (see Figure 4.5). To the contrary, the data indicate that average sample sizes have been remarkably stable since 1985, despite the improved ease of collecting participants with data collection tools such as online services.
However, what has changed is the amount of nonsignificant results reported in the literature. Our data show that more nonsignificant results are reported throughout the years (see Figure 4.2), which seems contrary to findings that indicate that relatively more significant results are being reported (Fanelli 2011; Sterling, Rosenbaum, and Weinkam 1995; Sterling 1959; De Winter and Dodou 2015). It would seem the field is not shying away from publishing negative results per se, as proposed before (Fanelli 2011; Greenwald 1975; Nosek, Spies, and Motyl 2012; Rosenthal 1979; Schimmack 2012), but whether this is also the case for results relating to hypotheses of explicit interest in a study and not all results reported in a paper, requires further research. Other research strongly suggests that most reported results relating to hypotheses of explicit interest are statistically significant (Open Science Collaboration 2015).
4.3 Application 2: Evidence of false negative gender effects in eight major psychology journals
In order to illustrate the practical value of the Fisher test to test for evidential value of (non)significant \(p\)-values, we investigated gender related effects in a random subsample of our database. Gender effects are particularly interesting because gender is typically a control variable and not the primary focus of studies. Hence, we expect little \(p\)-hacking and substantial evidence of false negatives in reported gender effects in psychology. We apply the Fisher test to significant and nonsignificant gender results to test for evidential value (Van Assen, Van Aert, and Wicherts 2015; Simonsohn, Nelson, and Simmons 2014). More precisely, we investigate whether evidential value depends on whether or not the result is statistically significant, and whether or not the results were in line with expectations expressed in the paper.
4.3.1 Method
We planned to test for evidential value in six categories (expectation [3 levels] \(\times\) significance [2 levels]). Expectations were specified as ‘\(H_1\) expected’, ‘\(H_0\) expected’, or ‘no expectation’. Prior to data collection, we assessed the required sample size for the Fisher test based on research on the gender similarities hypothesis (Hyde 2005). We calculated that the required number of statistical results for the Fisher test, given \(r=.11\) (Hyde 2005) and 80% power, is 15 \(p\)-values per condition, requiring 90 results in total. However, the six categories are unlikely to occur equally throughout the literature, hence we sampled 90 significant and 90 nonsignificant results pertaining to gender, with an expected cell size of 30 if results are equally distributed across the six cells of our design. Significance was coded based on the reported \(p\)-value, where \(\leq.05\) was used as the decision criterion to determine significance (Nuijten, Hartgerink, et al. 2015).
We sampled the 180 gender results from our database of over 250,000 test results in four steps. First, we automatically searched for “gender”, “sex”, “female” AND “male”, " man" AND " woman" [sic], or " men" AND " women" [sic] in the \(100\) characters before the statistical result and \(100\) after the statistical result (i.e., range of \(200\) characters surrounding the result), which yielded 27,523 results. Second, the first author inspected \(500\) characters before and after the first result of a randomly ordered list of all 27,523 results and coded whether it indeed pertained to gender. This was done until 180 results pertaining to gender were retrieved from 180 different articles. Third, these results were independently coded by all authors with respect to the expectations of the original researcher(s) (coding scheme available at https://osf.io/9ev63). The coding included checks for qualifiers pertaining to the expectation of the statistical result (confirmed/theorized/hypothesized/expected/etc.). If researchers reported such a qualifier, we assumed they correctly represented these expectations with respect to the statistical significance of the result. For example, if the text stated “as expected no evidence for an effect was found, \(t(12)=1, p=.337\)” we assumed the authors expected a nonsignificant result. Fourth, discrepant codings were resolved by discussion (25 cases [13.9%]; two cases remained unresolved and were dropped). 178 valid results remained for analysis.
Prior to analyzing these 178 \(p\)-values for evidential value with the Fisher test, we transformed them to variables ranging from 0 to 1. Statistically nonsignificant results were transformed with Equation (4.1); statistically significant \(p\)-values were divided by alpha .05 (Van Assen, Van Aert, and Wicherts 2015; Simonsohn, Nelson, and Simmons 2014).
4.3.2 Results
The coding of the 178 results indicated that results rarely specify whether these are in line with the hypothesized effect (see Table 4.5. For the 178 results, only 15 clearly stated whether their results were as expected, whereas the remaining 163 did not. Illustrative of the lack of clarity in expectations is the following quote: “As predicted, there was little gender difference […] p < .06.” There were two results that were presented as significant but contained \(p\)-values larger than .05; these two were dropped (i.e., 176 results were analyzed). As a result, the conditions significant-\(H_0\) expected, nonsignificant-\(H_0\) expected, and nonsignificant-\(H_1\) expected contained too few results for meaningful investigation of evidential value (i.e., with sufficient statistical power).
| \(H_0\) expected | \(H_1\) expected | No expectation | |
|---|---|---|---|
| Significant | 0 | 11 | 75 |
| Nonsignificant | 2 | 1 | 87 |
Figure 4.6 presents the distributions of both transformed significant and non-significant \(p\)-values. For significant results, applying the Fisher test to the \(p\)-values showed evidential value for a gender effect both when an effect was expected (\(\chi^2(22)=358.904\), \(p<.001\)) and when no expectation was presented at all (\(\chi^2(15)=1094.911\), \(p<.001\)). Similarly, applying the Fisher test to nonsignificant gender results without stated expectation yielded evidence of at least one false negative (\(\chi^2(174)=324.374\), \(p<.001\)). Unfortunately, we could not examine whether evidential value of gender effects is dependent on the hypothesis/expectation of the researcher, because these effects are most frequently reported without stated expectations.
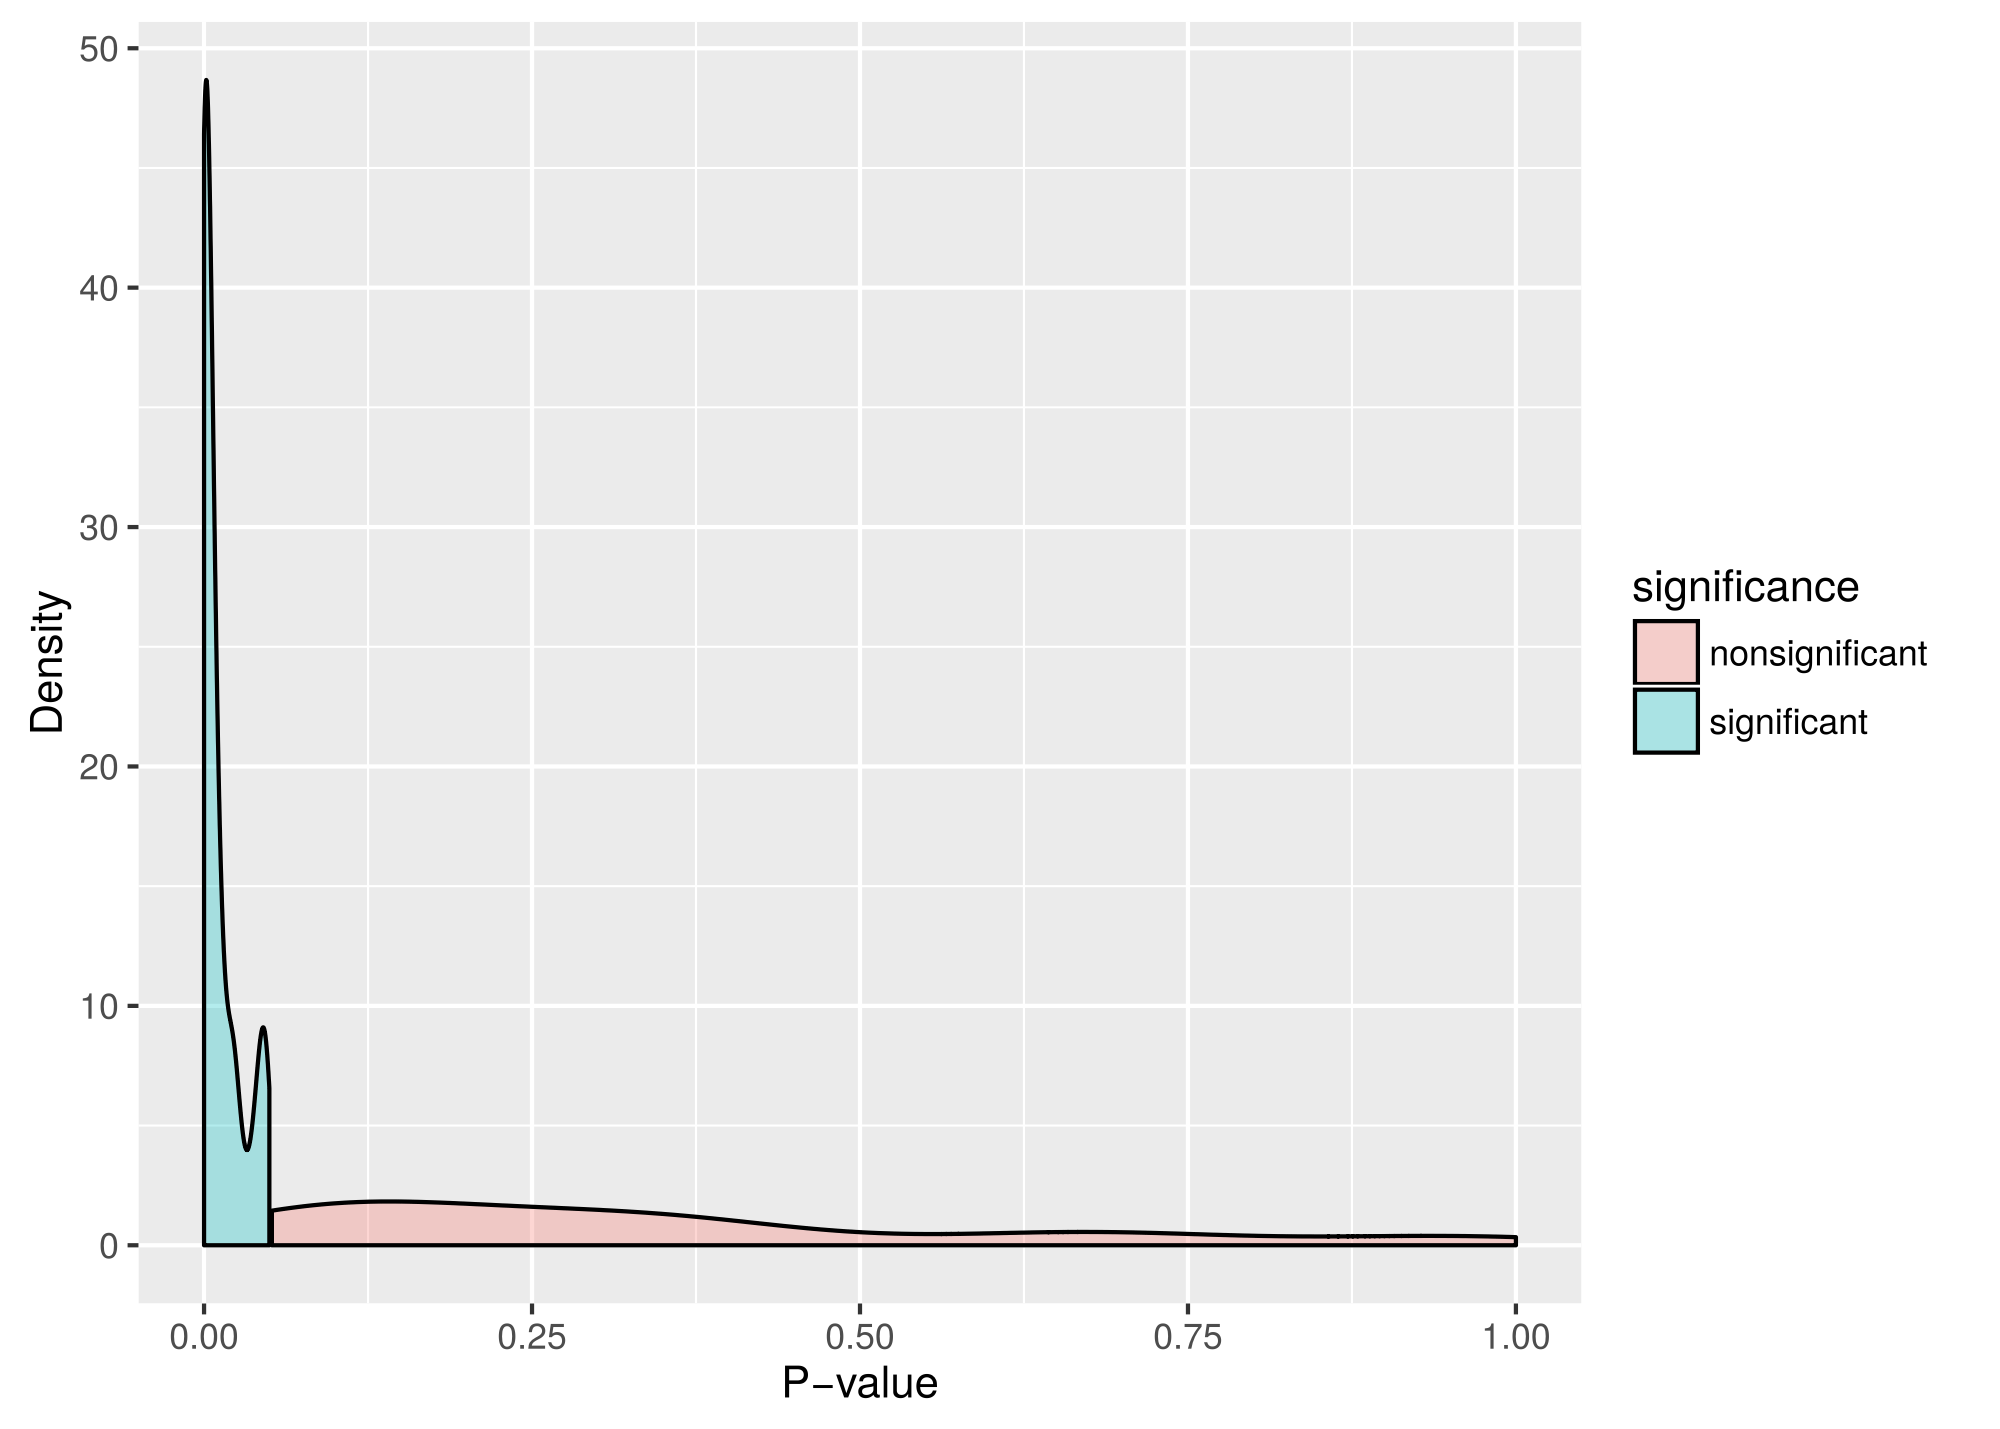
Figure 4.6: Probability density distributions of the \(p\)-values for gender effects, split for nonsignificant and significant results. A uniform density distribution indicates the absence of a true effect.
4.3.3 Discussion
We observed evidential value of gender effects both in the statistically significant (no expectation or \(H_1\) expected) and nonsignificant results (no expectation). The data from the 178 results we investigated indicated that in only 15 cases the expectation of the test result was clearly explicated. This indicates that based on test results alone, it is very difficult to differentiate between results that relate to a priori hypotheses and results that are of an exploratory nature. The importance of being able to differentiate between confirmatory and exploratory results has been previously demonstrated (Wagenmakers et al. 2012) and has been incorporated into the Transparency and Openness Promotion guidelines (TOP; Nosek et al. 2015) with explicit attention paid to pre-registration.
4.4 Application 3: Reproducibility Project Psychology
Out of the 100 replicated studies in the RPP, 64 did not yield a statistically significant effect size, despite the fact that high replication power was one of the aims of the project (Open Science Collaboration 2015). Regardless, the authors suggested “…that at least one replication could be a false negative” (p. aac4716-4). Here we estimate how many of these nonsignificant replications might be false negative, by applying the Fisher test to these nonsignificant effects.
4.4.1 Method
Of the 64 nonsignificant studies in the RPP data (https://osf.io/fgjvw), we selected the 63 nonsignificant studies with a test statistic. We eliminated one result because it was a regression coefficient that could not be used in the following procedure. We first applied the Fisher test to the nonsignificant results, after transforming them to variables ranging from 0 to 1 using equations (4.1) and (4.2). Denote the value of this Fisher test by \(Y\); note that under the \(H_0\) of no evidential value \(Y\) is \(\chi^2\)-distributed with 126 degrees of freedom.
Subsequently, we hypothesized that \(X\) out of these 63 nonsignificant results had a weak, medium, or strong population effect size (i.e., \(\rho=.1\), \(.3\), \(.5\), respectively; Cohen 1988) and the remaining \(63-X\) had a zero population effect size. For each of these hypotheses, we generated 10,000 data sets (see next paragraph for details) and used them to approximate the distribution of the Fisher test statistic (i.e., \(Y\)). Using this distribution, we computed the probability that a \(\chi^2\)-value exceeds \(Y\), further denoted by \(p_Y\). We then used the inversion method (Casella and Berger 2001) to compute confidence intervals of \(X\), the number of nonzero effects. Specifically, the confidence interval for \(X\) is (\(X_{LB};X_{UB}\)), where \(X_{LB}\) is the value of \(X\) for which \(p_Y\) is closest to \(.025\) and \(X_{UB}\) is the value of \(X\) for which \(p_Y\) is closest to \(.975\). We computed three confidence intervals of \(X\): one for the number of weak, medium, and large effects.
We computed \(p_Y\) for a combination of a value of \(X\) and a true effect size using 10,000 randomly generated datasets, in three steps. For each dataset we: + Randomly selected \(X\) out of 63 effects which are supposed to be generated by true nonzero effects, with the remaining \(63-X\) supposed to be generated by true zero effects; + Given the degrees of freedom of the effects, we randomly generated \(p\)-values under the \(H_0\) using the central distributions and non-central distributions (for the \(63-X\) and \(X\) effects selected in step 1, respectively); + The Fisher statistic \(Y\) was computed by applying Equation (5.2) to the transformed \(p\)-values (see Equation (5.1)) of step 2. Probability \(p_Y\) equals the proportion of 10,000 datasets with \(Y\) exceeding the value of the Fisher statistic applied to the RPP data. See osf.io/egnh9 for the analysis script to compute the confidence intervals of \(X\).
4.4.2 Results
Upon reanalysis of the 63 statistically nonsignificant replications within RPP we determined that many of these “failed” replications say hardly anything about whether there are truly no effects when using the adapted Fisher method. The Fisher test of these 63 nonsignificant results indicated some evidence for the presence of at least one false negative finding (\(\chi^2(126)=155.2382\), \(p=0.039\)). Assuming \(X\) small nonzero true effects among the nonsignificant results yields a confidence interval of 0-63 (0-100%). More specifically, if all results are in fact true negatives then \(p_Y=.039\), whereas if all true effects are \(\rho=.1\) then \(p_Y=.872\). Hence, the 63 statistically nonsignificant results of the RPP are in line with any number of true small effects — from none to all. Consequently, we cannot draw firm conclusions about the state of the field psychology concerning the frequency of false negatives using the RPP results and the Fisher test, when all true effects are small. Assuming \(X\) medium or strong true effects underlying the nonsignificant results from RPP yields confidence intervals 0-21 (0-33.3%) and 0-13 (0-20.6%), respectively. In other words, the 63 statistically nonsignificant RPP results are also in line with some true effects actually being medium or even large.
4.4.3 Discussion
The reanalysis of the nonsignificant RPP results using the Fisher method demonstrates that any conclusions on the validity of individual effects based on “failed” replications, as determined by statistical significance, is unwarranted. This was also noted by both the original RPP team (Open Science Collaboration 2015; Anderson et al. 2016) and in a critique of the RPP (Gilbert et al. 2016). Replication efforts such as the RPP or the Many Labs project remove publication bias and result in a less biased assessment of the true effect size. Nonetheless, single replications should not be seen as the definitive result, considering that these results indicate there remains much uncertainty about whether a nonsignificant result is a true negative or a false negative. The explanation of this finding is that most of the RPP replications, although often statistically more powerful than the original studies, still did not have enough statistical power to distinguish a true small effect from a true zero effect (Maxwell, Lau, and Howard 2015). Interpreting results of replications should therefore also take the precision of the estimate of both the original and replication into account (Cumming 2013) and publication bias of the original studies (Etz and Vandekerckhove 2016).
Very recently four statistical papers have re-analyzed the RPP results to either estimate the frequency of studies testing true zero hypotheses or to estimate the individual effects examined in the original and replication study. All four papers account for the possibility of publication bias in the original study. Johnson et al. (2016) estimated a Bayesian statistical model including a distribution of effect sizes among studies for which the null-hypothesis is false. On the basis of their analyses they conclude that at least 90% of psychology experiments tested negligible true effects. Johnson et al.’s model as well as our Fisher’s test are not useful for estimation and testing of individual effects examined in original and replication study. Interpreting results of individual effects should take the precision of the estimate of both the original and replication into account (Cumming 2013). Etz and Vandekerckhove (2016) reanalyzed the RPP at the level of individual effects, using Bayesian models incorporating publication bias. They concluded that 64% of individual studies did not provide strong evidence for either the null or the alternative hypothesis in either the original of the replication study. This agrees with our own and Maxwell, Lau, and Howard (2015) their interpretation of the RPP findings. As opposed to Etz and Vandekerckhove (2016), Van Aert and Van Assen (2017b) use a statistically significant original and a replication study to evaluate the common true underlying effect size, adjusting for publication bias. From their Bayesian analysis (Van Aert and Van Assen 2017a) assuming equally likely zero, small, medium, large true effects, they conclude that only 13.4% of individual effects contain substantial evidence (Bayes factor > 3) of a true zero effect. For a staggering 62.7% of individual effects no substantial evidence in favor zero, small, medium, or large true effect size was obtained. All in all, conclusions of our analyses using the Fisher are in line with other statistical papers re-analyzing the RPP data (with the exception of Johnson et al. 2016) suggesting that studies in psychology are typically not powerful enough to distinguish zero from nonzero true findings.
4.5 General Discussion
Much attention has been paid to false positive results in recent years. Our study demonstrates the importance of paying attention to false negatives alongside false positives. We examined evidence for false negatives in nonsignificant results in three different ways. Specifically, we adapted the Fisher method to detect the presence of at least one false negative in a set of statistically nonsignificant results. Simulations indicated the adapted Fisher test to be a powerful method for that purpose. The three applications indicated that (i) approximately two out of three psychology articles reporting nonsignificant results contain evidence for at least one false negative, (ii) nonsignificant results on gender effects contain evidence of true nonzero effects, and (iii) the statistically nonsignificant replications from the Reproducibility Project Psychology (RPP) do not warrant strong conclusions about the absence or presence of true zero effects underlying these nonsignificant results (RPP does yield less biased estimates of the effect; the original studies severely overestimated the effects of interest).
The methods used in the three different applications provide crucial context to interpret the results. In applications 1 and 2, we did not differentiate between main and peripheral results. Hence, the interpretation of a significant Fisher test result pertains to the evidence of at least one false negative in all reported results, not the evidence for at least one false negative in the main results. Nonetheless, even when we focused only on the main results in application 3, the Fisher test does not indicate specifically which result is false negative, rather it only provides evidence for a false negative in a set of results. As such, the Fisher test is primarily useful to test a set of potentially underpowered results in a more powerful manner, albeit that the result then applies to the complete set. Additionally, in applications 1 and 2 we focused on results reported in eight psychology journals; extrapolating the results to other journals might not be warranted given that there might be substantial differences in the type of results reported in other journals or fields.
More generally, our results in these three applications confirm that the problem of false negatives in psychology remains pervasive. Previous concern about power (Cohen 1962; Sedlmeier and Gigerenzer 1989; Bakker, Dijk, and Wicherts 2012; Marszalek et al. 2011), which was even addressed by an APA Statistical Task Force in 1999 that recommended increased statistical power (Wilkinson 1999), seems not to have resulted in actual change (Marszalek et al. 2011). Potential explanations for this lack of change is that researchers overestimate statistical power when designing a study for small effects (Bakker et al. 2016), use \(p\)-hacking to artificially increase statistical power, and can act strategically by running multiple underpowered studies rather than one large powerful study (Bakker, Dijk, and Wicherts 2012). The effects of \(p\)-hacking are likely to be the most pervasive, with many people admitting to using such behaviors at some point (John, Loewenstein, and Prelec 2012) and publication bias pushing researchers to find statistically significant results. As such, the problems of false positives, publication bias, and false negatives are intertwined and mutually reinforcing.
Reducing the emphasis on binary decisions in individual studies and increasing the emphasis on the precision of a study might help reduce the problem of decision errors (Cumming 2013). For example, a large but statistically nonsignificant study might yield a confidence interval (CI) of the effect size of [-0.01; 0.05], whereas a small but significant study might yield a CI of [0.01; 1.30]. In a purely binary decision mode, the small but significant study would result in the conclusion that there is an effect because it provided a statistically significant result, despite it containing much more uncertainty than the larger study about the underlying true effect size. In a precision mode, the large study provides a more certain estimate and therefore is deemed more informative and provides the best estimate. Using meta-analyses to combine estimates obtained in studies on the same effect may further increase the overall estimate’s precision. Although the emphasis on precision and the meta-analytic approach is fruitful in theory, we should realize that publication bias will result in precise but biased (overestimated) effect size estimation of meta-analyses (Nuijten, Van Assen, et al. 2015).
4.5.1 Limitations and further research
For all three applications, the Fisher tests’ conclusions are limited to detecting at least one false negative in a set of results. The method cannot be used to draw inferences on individuals results in the set. To draw inferences on the true effect size underlying one specific observed effect size, generally more information (i.e., studies) is needed to increase the precision of the effect size estimate.
Another potential caveat relates to the data collected with the R package statcheck and used in applications 1 and 2. statcheck extracts inline, APA style reported test statistics, but does not include results included from tables or results that are not reported as the APA prescribes. Consequently, our results and conclusions may not be generalizable to all results reported in articles.
Given that the results indicate that false negatives are still a problem in psychology, albeit slowly on the decline in published research, further research is warranted. Further research could focus on comparing evidence for false negatives in main and peripheral results. Our results in combination with results of previous studies suggest that publication bias mainly operates on results of tests of main hypotheses, and less so on peripheral results. Another venue for future research is using the Fisher test to re-examine evidence in the literature on certain other effects or often-used covariates, such as age and race, or to see if it helps researchers prevent dichotomous thinking with individual \(p\)-values (Hoekstra et al. 2006). Finally, the Fisher test may and is also used to meta-analyze effect sizes of different studies. Whereas Fisher used his method to test the null-hypothesis of an underlying true zero effect using several studies’ \(p\)-values, the method has recently been extended to yield unbiased effect estimates using only statistically significant \(p\)-values. The principle of uniformly distributed \(p\)-values given the true effect size on which the Fisher method is based, also underlies newly developed methods of meta-analysis that adjust for publication bias, such as \(p\)-uniform (Van Assen, Van Aert, and Wicherts 2015) and \(p\)-curve (Simonsohn, Nelson, and Simmons 2014). Extensions of these methods to include nonsignificant as well as significant \(p\)-values and to estimate heterogeneity are still under construction.
To conclude, our three applications indicate that false negatives remain a problem in the psychology literature, despite the decreased attention and that we should be wary to interpret statistically nonsignificant results as there being no effect in reality. One way to combat this interpretation of statistically nonsignificant results is to incorporate testing for potential false negatives, which the Fisher method facilitates in a highly approachable manner (a spreadsheet for carrying out such a test is available at https://osf.io/tk57v/).
References
Aberson, Christopher L. 2010. “What is power? Why is power important?” In Applied power analysis for the behavioral sciences, edited by Christopher L Aberson. New York, NY: Routledge.
American Psychological Association. 2010b. Publication Manual of the American Psychological Association. 6th ed. Washington, DC: American Psychological Association.
Anderson, C. J., t pan Bahnik, M. Barnett-Cowan, F. A. Bosco, J. Chandler, C. R. Chartier, F. Cheung, et al. 2016. “Response to Comment on ‘Estimating the Reproducibility of Psychological Science’.” Science 351 (6277). American Association for the Advancement of Science (AAAS): 1037–7. doi:10.1126/science.aad9163.
Bakan, David. 1966. “The Test of Significance in Psychological Research.” Psychological Bulletin 66 (6). American Psychological Association (APA): 423–37. doi:10.1037/h0020412.
Bakker, Marjan, and Jelte M Wicherts. 2011. “The (Mis)reporting of Statistical Results in Psychology Journals.” Behavior Research Methods 43 (3): 666–78. doi:10.3758/s13428-011-0089-5.
Bakker, Marjan, Annette van Dijk, and Jelte M Wicherts. 2012. “The rules of the game called psychological science.” Perspectives on Psychological Science 7 (6): 543–54. doi:10.1177/1745691612459060.
Bakker, Marjan, Chris H. J. Hartgerink, Jelte M. Wicherts, and Han L. J. van der Maas. 2016. “Researchers’ Intuitions About Power in Psychological Research.” Psychological Science 27 (8). SAGE Publications: 1069–77. doi:10.1177/0956797616647519.
Begley, C. Glenn, and Lee M. Ellis. 2012. “Raise Standards for Preclinical Cancer Research.” Nature 483 (7391). Springer Nature: 531–33. doi:10.1038/483531a.
Borenstein, Michael, Larry V. Hedges, Julian P. T. Higgins, and Hannah R. Rothstein. 2011. Introduction to Meta-Analysis. Wiley.
Camerer, C. F., A. Dreber, E. Forsell, T.-H. Ho, J. Huber, M. Johannesson, M. Kirchler, et al. 2016. “Evaluating Replicability of Laboratory Experiments in Economics.” Science 351 (6280). American Association for the Advancement of Science (AAAS): 1433–6. doi:10.1126/science.aaf0918.
Casella, George, and Roger L. Berger. 2001. Statistical Inference. Cengage Learning.
Cohen, Jacob. 1962. “The Statistical Power of Abnormal-Social Psychological Research: A Review.” The Journal of Abnormal and Social Psychology 65 (3). American Psychological Association (APA): 145–53. doi:10.1037/h0045186.
Cohen, Jacob. 1988. Statistical Power Analysis for the Behavioral Sciences (2nd Edition). Routledge.
Cumming, Geoff. 2013. “The New Statistics.” Psychological Science 25 (1). SAGE Publications: 7–29. doi:10.1177/0956797613504966.
De Winter, Joost CF, and Dimitra Dodou. 2015. “A Surge of P-Values Between 0.041 and 0.049 in Recent Decades (but Negative Results Are Increasing Rapidly Too).” PeerJ 3 (January). PeerJ: e733. doi:10.7717/peerj.733.
Epskamp, Sacha, and Michèle B. Nuijten. 2016. Statcheck: Extract Statistics from Articles and Recompute P Values. https://CRAN.R-project.org/package=statcheck.
Etz, Alexander, and Joachim Vandekerckhove. 2016. “A Bayesian Perspective on the Reproducibility Project: Psychology.” Edited by DanieleEditor Marinazzo. PLOS ONE 11 (2). Public Library of Science (PLoS): e0149794. doi:10.1371/journal.pone.0149794.
Fanelli, Daniele. 2011. “Negative Results Are Disappearing from Most Disciplines and Countries.” Scientometrics 90 (3). Springer Nature: 891–904. doi:10.1007/s11192-011-0494-7.
Fiedler, Klaus, Florian Kutzner, and Joachim I. Krueger. 2012. “The Long Way from Alpha-Error Control to Validity Proper.” Perspectives on Psychological Science 7 (6). SAGE Publications: 661–69. doi:10.1177/1745691612462587.
Fisher, Ronald Aylmer. 1925. Statistical methods for research workers. Edinburg, United Kingdom: Oliver Boyd.
Fraley, R. Chris, and Simine Vazire. 2014. “The N-Pact Factor: Evaluating the Quality of Empirical Journals with Respect to Sample Size and Statistical Power.” Edited by Christos A.Editor Ouzounis. PLoS ONE 9 (10). Public Library of Science (PLoS): e109019. doi:10.1371/journal.pone.0109019.
Francis, Gregory. 2012. “Too Good to Be True: Publication Bias in Two Prominent Studies from Experimental Psychology.” Psychonomic Bulletin & Review 19 (2). Springer Nature: 151–56. doi:10.3758/s13423-012-0227-9.
Gignac, Gilles E., and Eva T. Szodorai. 2016. “Effect Size Guidelines for Individual Differences Researchers.” Personality and Individual Differences 102 (November). Elsevier BV: 74–78. doi:10.1016/j.paid.2016.06.069.
Gilbert, D. T., G. King, S. Pettigrew, and T. D. Wilson. 2016. “Comment on ‘Estimating the Reproducibility of Psychological Science’.” Science 351 (6277). American Association for the Advancement of Science (AAAS): 1037–7. doi:10.1126/science.aad7243.
Giner-Sorolla, Roger. 2012. “Science or Art? How Aesthetic Standards Grease the Way Through the Publication Bottleneck but Undermine Science.” Perspectives on Psychological Science 7 (6). SAGE Publications: 562–71. doi:10.1177/1745691612457576.
Goodman, Steven. 2008. “A Dirty Dozen: Twelve P-Value Misconceptions.” Seminars in Hematology 45 (3). Elsevier BV: 135–40. doi:10.1053/j.seminhematol.2008.04.003.
Greenwald, Anthony G. 1975. “Consequences of Prejudice Against the Null Hypothesis.” Psychological Bulletin 82 (1). American Psychological Association (APA): 1–20. doi:10.1037/h0076157.
Hartgerink, Chris H. J., Robbie C. M. Van Aert, Michèle B. Nuijten, Jelte M. Wicherts, and Marcel A.L.M. Van Assen. 2016. “Distributions Ofp-Values Smaller Than .05 in Psychology: What Is Going on?” PeerJ 4 (April). PeerJ: e1935. doi:10.7717/peerj.1935.
Hedges, L V, and I Olkin. 1985. Statistical methods for meta-analysis. London, United Kingdom: Academic Press.
Hedges, Larry V. 1981. “Distribution Theory for Glass’s Estimator of Effect Size and Related Estimators.” Journal of Educational Statistics 6 (2). American Educational Research Association (AERA): 107–28. doi:10.3102/10769986006002107.
Hoekstra, Rink, Sue Finch, Henk A. L. Kiers, and Addie Johnson. 2006. “Probability as Certainty: Dichotomous Thinking and the Misuse Ofp Values.” Psychonomic Bulletin & Review 13 (6). Springer Nature: 1033–7. doi:10.3758/bf03213921.
Hyde, Janet Shibley. 2005. “The Gender Similarities Hypothesis.” American Psychologist 60 (6). American Psychological Association (APA): 581–92. doi:10.1037/0003-066x.60.6.581.
Ioannidis, John P. A. 2005. “Why Most Published Research Findings Are False.” PLoS Medicine 2 (8). Public Library of Science (PLoS): e124. doi:10.1371/journal.pmed.0020124.
Ioannidis, John PA, and Thomas A Trikalinos. 2007. “An Exploratory Test for an Excess of Significant Findings.” Clinical Trials: Journal of the Society for Clinical Trials 4 (3). SAGE Publications: 245–53. doi:10.1177/1740774507079441.
John, Leslie K, George Loewenstein, and Drazen Prelec. 2012. “Measuring the prevalence of questionable research practices with incentives for truth telling.” Psychological Science 23 (5): 524–32. doi:10.1177/0956797611430953.
Johnson, Valen E., Richard D. Payne, Tianying Wang, Alex Asher, and Soutrik Mandal. 2016. “On the Reproducibility of Psychological Science.” Journal of the American Statistical Association 112 (517). Informa UK Limited: 1–10. doi:10.1080/01621459.2016.1240079.
Klein, Richard A., Kate A Ratliff, Michelangelo Vianello, Reginald B Adams Jr., Štěpán Bahník, Michael J Bernstein, Konrad Bocian, et al. 2014. “Investigating Variation in Replicability.” Social Psychology 45 (3): 142–52. doi:10.1027/1864-9335/a000178.
Lane, David M., and William P. Dunlap. 1978. “Estimating Effect Size: Bias Resulting from the Significance Criterion in Editorial Decisions.” British Journal of Mathematical and Statistical Psychology 31 (2). Wiley: 107–12. doi:10.1111/j.2044-8317.1978.tb00578.x.
Marszalek, Jacob M., Carolyn Barber, Julie Kohlhart, and B. Holmes Cooper. 2011. “Sample Size in Psychological Research over the Past 30 Years.” Perceptual and Motor Skills 112 (2). SAGE Publications: 331–48. doi:10.2466/03.11.pms.112.2.331-348.
Massey, Frank J. 1951. “The Kolmogorov-Smirnov Test for Goodness of Fit.” Journal of the American Statistical Association 46 (253). JSTOR: 68. doi:10.2307/2280095.
Maxwell, Scott E., Michael Y. Lau, and George S. Howard. 2015. “Is Psychology Suffering from a Replication Crisis? What Does ‘Failure to Replicate’ Really Mean?” American Psychologist 70 (6). American Psychological Association (APA): 487–98. doi:10.1037/a0039400.
Meehl, Paul E. 2004. “Theoretical Risks and Tabular Asterisks: Sir Karl, Sir Ronald, and the Slow Progress of Soft Psychology.” Applied and Preventive Psychology 11 (1). Elsevier BV: 1. doi:10.1016/j.appsy.2004.02.001.
Nosek, B A, G Alter, G C Banks, D Borsboom, S D Bowman, S J Breckler, S Buck, et al. 2015. “Promoting an Open Research Culture.” Science 348 (6242): 1422–5. doi:10.1126/science.aab2374.
Nosek, Brian A, Jeffrey R Spies, and Matt Motyl. 2012. “Scientific Utopia: II. Restructuring Incentives and Practices to Promote Truth over Publishability.” Perspectives on Psychological Science 7 (6): 615–31. doi:10.1177/1745691612459058.
Nuijten, Michèle B., Chris H. J. Hartgerink, Marcel A.L.M. Van Assen, Epskamp Sacha, and Jelte M. Wicherts. 2015. “The Prevalence of Statistical Reporting Errors in Psychology (1985–2013).” Behavior Research Methods 48 (4). Springer Nature: 1205–26. doi:10.3758/s13428-015-0664-2.
Nuijten, Michèle B., Marcel A. L. M. Van Assen, Coosje L. S. Veldkamp, and Jelte M. Wicherts. 2015. “The Replication Paradox: Combining Studies Can Decrease Accuracy of Effect Size Estimates.” Review of General Psychology 19 (2). American Psychological Association (APA): 172–82. doi:10.1037/gpr0000034.
Open Science Collaboration. 2015. “Estimating the Reproducibility of Psychological Science.” Science 349 (6251). doi:10.1126/science.aac4716.
Popper, Karl. 2002. The Logic of Scientific Discovery (Routledge Classics). Routledge.
Rosenthal, Robert. 1979. “The File Drawer Problem and Tolerance for Null Results.” Psychological Bulletin 86 (3). American Psychological Association (APA): 638–41. doi:10.1037/0033-2909.86.3.638.
Rothstein, Hannah. 2005. Publication Bias in Meta-Analysis : Prevention, Assessment and Adjustments. Chichester, England Hoboken, NJ: Wiley.
Schimmack, Ulrich. 2012. “The Ironic Effect of Significant Results on the Credibility of Multiple-Study Articles.” Psychological Methods 17 (4). American Psychological Association (APA): 551–66. doi:10.1037/a0029487.
Sedlmeier, Peter, and Gerd Gigerenzer. 1989. “Do Studies of Statistical Power Have an Effect on the Power of Studies?” Psychological Bulletin 105 (2). American Psychological Association (APA): 309–16. doi:10.1037/0033-2909.105.2.309.
Simonsohn, Uri, Leif D. Nelson, and Joseph P. Simmons. 2014. “P-Curve: A Key to the File-Drawer.” Journal of Experimental Psychology: General 143 (2). American Psychological Association (APA): 534–47. doi:10.1037/a0033242.
Stanley, David J., and Jeffrey R. Spence. 2014. “Expectations for Replications.” Perspectives on Psychological Science 9 (3). SAGE Publications: 305–18. doi:10.1177/1745691614528518.
Sterling, T. D., W. L. Rosenbaum, and J. J. Weinkam. 1995. “Publication Decisions Revisited: The Effect of the Outcome of Statistical Tests on the Decision to Publish and Vice Versa.” The American Statistician 49 (1). JSTOR: 108. doi:10.2307/2684823.
Sterling, Theodore D. 1959. “Publication Decisions and Their Possible Effects on Inferences Drawn from Tests of Significance–or Vice Versa.” Journal of the American Statistical Association 54 (285). JSTOR: 30. doi:10.2307/2282137.
Sterne, Jonathan A.C, David Gavaghan, and Matthias Egger. 2000. “Publication and Related Bias in Meta-Analysis.” Journal of Clinical Epidemiology 53 (11). Elsevier BV: 1119–29. doi:10.1016/s0895-4356(00)00242-0.
Van Aert, Robbie C. M., and Marcel A. L. M. Van Assen. 2017a. “Bayesian Evaluation of Effect Size After Replicating an Original Study.” Edited by DanieleEditor Marinazzo. PLOS ONE 12 (4). Public Library of Science (PLoS): e0175302. doi:10.1371/journal.pone.0175302.
Van Aert, Robbie C. 2017b. “Examining Reproducibility in Psychology: A Hybrid Method for Combining a Statistically Significant Original Study and a Replication.” Behavior Research Methods 50 (4). Springer Nature America, Inc: 1515–39. doi:10.3758/s13428-017-0967-6.
Van Assen, Marcel A. L. M., Robbie C. M. Van Aert, and Jelte M. Wicherts. 2015. “Meta-Analysis Using Effect Size Distributions of Only Statistically Significant Studies.” Psychological Methods 20 (3). American Psychological Association (APA): 293–309. doi:10.1037/met0000025.
Voelkle, Manuel C., Phillip L. Ackerman, and Werner W. Wittmann. 2007. “Effect Sizes and F Ratios < 1.0.” Methodology 3 (1). Hogrefe Publishing Group: 35–46. doi:10.1027/1614-2241.3.1.35.
Wagenmakers, Eric-Jan, Ruud Wetzels, Denny Borsboom, Han L J van der Maas, and Rogier A Kievit. 2012. “An Agenda for Purely Confirmatory Research.” Perspectives on Psychological Science 7 (6): 632–38. doi:10.1177/1745691612463078.
Wilkinson, Leland. 1999. “Statistical Methods in Psychology Journals: Guidelines and Explanations.” American Psychologist 54 (8). American Psychological Association (APA): 594–604. doi:10.1037/0003-066x.54.8.594.